 Marina Lyubimova

⬤ Netflix shares are currently consolidating around $85 after pulling back sharply from recent highs near $130. The stock is now sitting in what technical analysts call a Wave 4 correction zone—a spot where downward momentum typically starts to lose steam. This price level lines up with important Fibonacci retracement points at $89.28 (38.2% level) and $75.32 (50% level), creating a zone where the stock could find support.
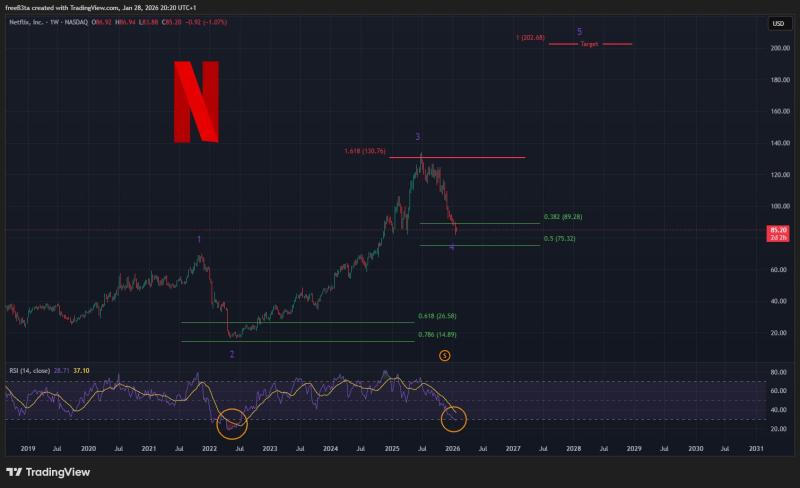
⬤ What makes this moment particularly interesting is the weekly RSI reading. The momentum indicator has dropped into oversold territory for the first time since May 2022. Back then, Netflix was wrapping up a brutal correction before staging a strong recovery that eventually pushed shares toward $130. The current oversold signal suggests selling pressure may be running out of gas, though it doesn't guarantee an immediate reversal.
⬤ From a wave structure perspective, the recent drop looks like a fourth-wave pullback within a bigger multi-year uptrend. While the stock has given back significant gains from the Wave 3 rally, it's still holding well above deeper support levels marked around $26 and $14. The chart also shows a longer-term target near $202 if Netflix can stabilize here and launch a new upward wave.
⬤ For the broader market, Netflix's behavior at this level matters because it's a bellwether for large-cap tech and growth stocks. If NFLX can hold the current zone and build momentum, it could signal that the worst of the selloff is behind us. But if these support levels break, the correction likely has more room to run. Either way, how Netflix trades from here will offer clues about where sentiment is headed for high-profile growth names.
 Marina Lyubimova


