 Usman Salis
⬤ Meta Platforms is catching traders' attention after printing a significant monthly hammer candle with a long lower wick that screams buyer interest. The stock bounced back hard after testing lower levels, climbing back to around $643.47. What makes this interesting is how quickly the price recovered from the dip into the low $580s earlier this month, showing that buyers weren't messing around when META hit those support zones.
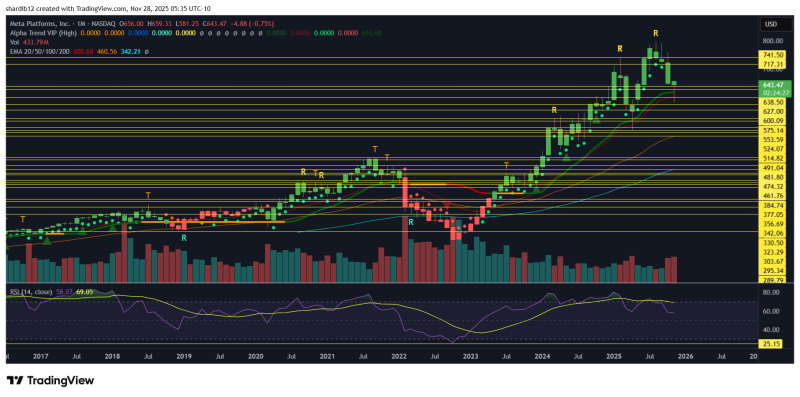
⬤ Looking at the bigger picture, META's been riding a solid long-term uptrend with plenty of key support and resistance levels marking important price zones. Even though the monthly candle is currently showing a small loss of about 0.75%, that hammer formation tells a different story. The long lower wick means sellers tried pushing the price down but got overwhelmed by buyers who saw value at those levels. The chart also highlights several historical turning points where META bounced before, suggesting these support areas have proven themselves reliable over time.
⬤ The moving averages paint an encouraging picture too. The 20, 50, 100, and 200-month EMAs are all trending upward, backing up META's structural strength despite the recent wobble. The monthly RSI is hanging around the mid-50s, which shows neutral momentum without any extreme conditions. What really stands out is how fast the selling pressure got absorbed, creating that distinctive hammer shape that technical traders love to see.
⬤ Why does this matter? Hammer patterns on monthly charts aren't something to brush off, especially when they show up near proven support levels. This could signal that the downside pressure is running out of steam. For anyone watching big tech stocks, META's price action suggests buyers are ready to defend key levels. Whether this hammer turns into sustained upside movement depends on how the month closes, but the pattern itself marks a clear shift in how traders are responding to pullbacks.
 Usman Salis


