Artem Voloskovets

⬤ Meta stock staged a clean bounce after touching a multi-year trendline that's been holding up the uptrend. The stock found solid support in the low 600s, specifically around the $585-$620 range, where it quickly reversed course. The weekly chart shows price hitting a rising dotted trendline and bouncing immediately, proving this support level is still doing its job in the bigger picture.
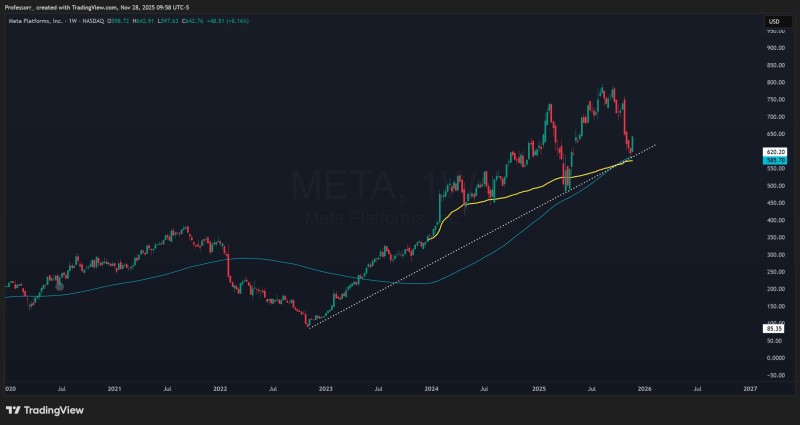
⬤ The chart captures META pulling back hard from recent highs before finding its footing near the support zone. This area lines up with the 100-week moving average, creating a confluence of support alongside the long-term price channel. The 200-week moving average sits below, adding more depth to this support cluster. META was also trading near its average weighted price over the longer timeframe, which helps explain why buyers stepped in at this level.
⬤ META has respected this broader trend since early 2023, consistently forming higher lows during pullbacks. Every previous touch of this trendline led to renewed buying pressure, and this latest bounce follows the same pattern. The stock closed its most recent weekly candle near $642, up more than 8%, visually confirming the strong reaction at support.
⬤ This matters because META is sitting at a crucial junction where long-term trend support meets short-term selling pressure. If the stock holds above this zone, it reinforces confidence in the multi-year uptrend. A breakdown below would signal a meaningful change in structure. The powerful weekly bounce shows traders are paying close attention as META decides its next major move.
 Artem Voloskovets