 Usman Salis

⬤ Meta Platforms (META) pushed higher this week, building on its confirmed reversal from November's bottom. The stock formed a key volatility zone between $583 and $606 on November 20, which marked the exact low point, while the final red candle on November 24 signaled the trend was turning back up. META closed at $673.42 in the latest session, showing solid recovery momentum from those late-month lows.
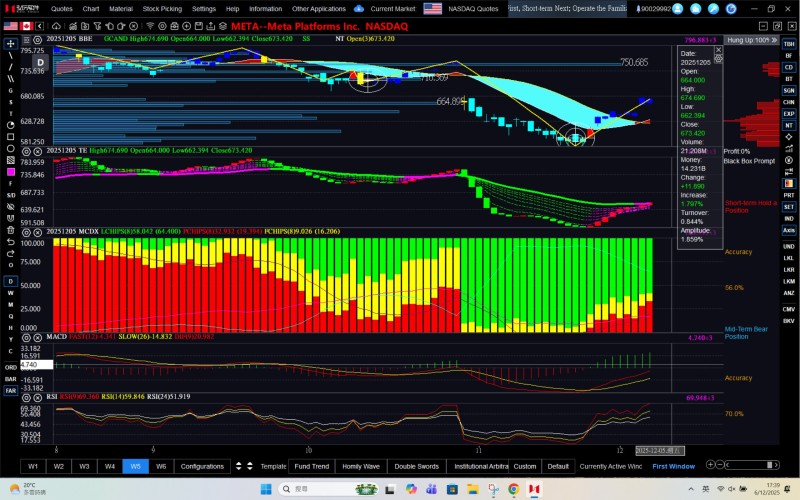
⬤ The technical picture keeps improving, with META climbing above its short-term moving averages while whale accumulation indicators show consistent support. The rebound from the volatility zone looks clean, backed by stronger histogram readings, better momentum curves, and rising accumulation levels. The setup in Panel 1 suggests another bullish signal could trigger soon if accumulation stays steady.
⬤ Recent trading reinforces this outlook, with 21.2 million shares changing hands and a 1.79% price gain in the last session. MACD readings are strengthening, RSI trends are climbing, and the stock has pushed past earlier resistance levels. After November's pullback, META has stabilized and built a clearer technical foundation for further gains.
⬤ What makes this setup interesting is that META seems to be entering a phase where trend stability and buying pressure could drive the next leg up. With several bullish signals lining up and key technical levels reclaimed, market sentiment is shifting positive. If accumulation holds and momentum continues, META looks positioned for more upside in the coming weeks.
 Usman Salis


