 Saad Ullah

⬤ Meta Platforms is currently sitting in consolidation mode on the 6-hour timeframe, with the stock price hanging around the middle of its recent trading range. The setup looks similar to what we've seen lately in other big tech names—basically, it's a waiting game until price climbs into those technically important zones overhead.
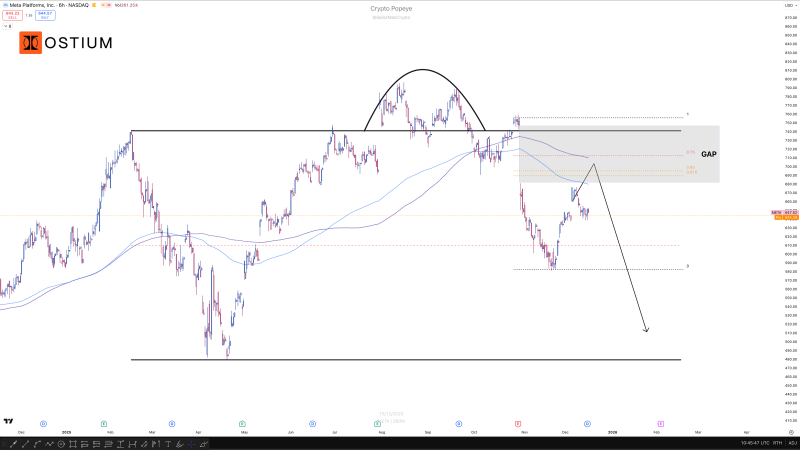
⬤ The chart shows a clear gap sitting above current levels, and it lines up nicely with key Fibonacci retracement points. After META took a sharp dive and then bounced back, it's worked its way into mid-range territory but hasn't challenged that upper resistance area yet. Right now, the stock's just kind of hanging out at the midpoint, which usually means there's not much to work with for quick trades.
⬤ From a technical standpoint, what traders really want to see is META pushing higher into that gap and Fibonacci overlap zone. That's where things could get interesting, not where we are right now. Until price actually gets up there, this is more of a watch-and-wait situation than anything actionable. The chart isn't screaming breakdown or breakout yet, which just confirms META is still building something before its next real move.
⬤ This consolidation matters for the broader market because Meta often mirrors what's happening across big tech stocks. When you get this kind of mid-range price action after a volatile period, it usually sets up for a sharper move once price finally hits those overhead technical levels. How META reacts if it reaches that gap and Fibonacci zone could tell us a lot about short-term market direction, especially if similar patterns keep showing up in comparable stocks.
 Saad Ullah


