 Saad Ullah

⬤ Meta Platforms (META) is catching traders' eyes as shares stabilize around $644 after November's sharp drop and quick recovery. The stock's sitting at what looks like a make-or-break level that's shown importance throughout the year. After falling hard last month, META bounced back aggressively but now seems to be running into resistance right where that rebound started losing steam.
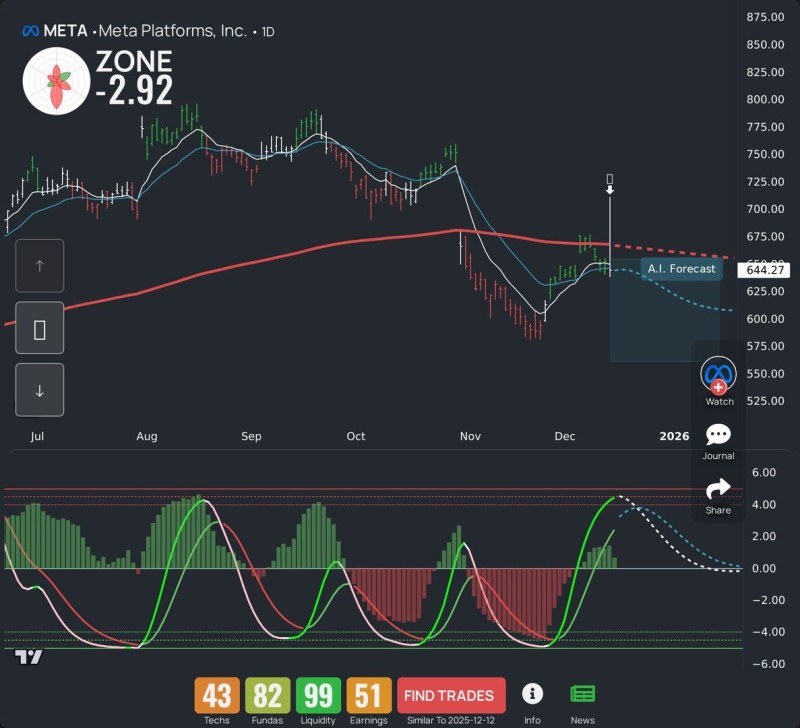
⬤ The daily chart reveals something interesting—META's dancing around a major long-term moving average that's acted like a magnet all year. Earlier in 2024, this level provided solid support, propping the stock up during pullbacks. But after META slipped below it in November, that same line has flipped into resistance. The stock managed to claw its way back, but now it's struggling to punch through that same zone again. It's one of those spots where price action tends to get choppy and direction can shift quickly.
⬤ META is "making noise" as momentum indicators tell a mixed story right now. The technical oscillator on the chart has climbed out of oversold territory, showing buyers stepped in after the selloff. But here's the catch—that same indicator is approaching overbought levels and starting to flatten out, which usually means the bounce might be running out of gas.
⬤ What's adding to the uncertainty is an AI-based forecast overlaid on the chart that's projecting a downward tilt into early 2025. If that prediction holds, META could drift lower or move sideways rather than breaking out. For the broader tech sector, META's next move matters—it's been a heavy lifter for the major indexes, and when stocks like this pause or pull back, it often signals a shift in risk appetite across growth names. Whether META can finally clear this resistance or follows the forecast lower could set the tone for communication services stocks in the weeks ahead.
 Saad Ullah


