 Usman Salis

⬤ Meta Platforms (META) is drawing attention as shares stabilize above $716, with AI-based trading models highlighting the stock's position after rebounding from late January. The chart shows META recovering ground rather than breaking out, with price moving back into a forecast zone that technical indicators have been tracking.
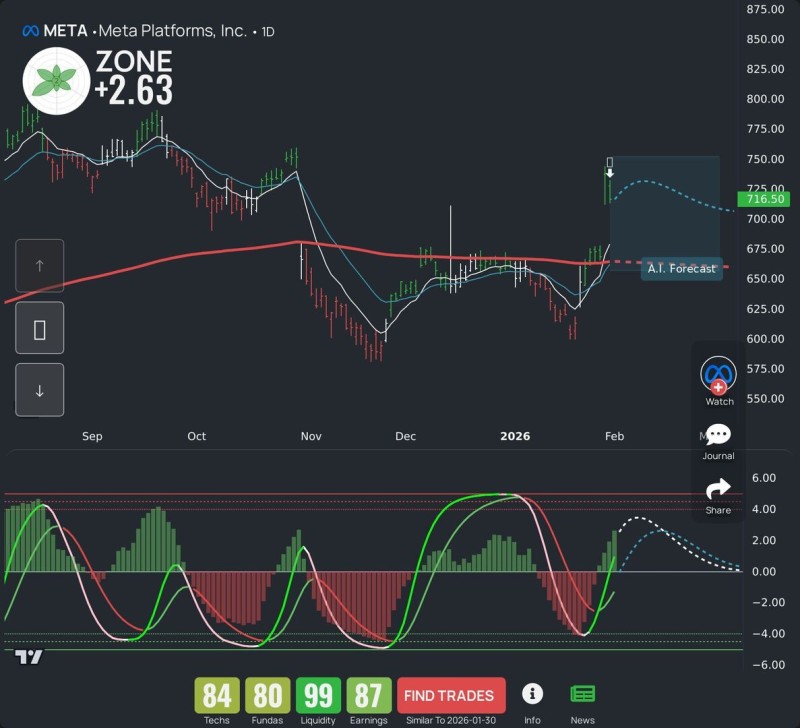
⬤ The daily chart reveals META climbing back toward a key long-term moving average that previously acted as resistance. After dipping into the low-$600s earlier this year, the stock has been forming higher lows—a sign that buyers are stepping in at better levels. The projected path shown on the chart represents potential movement rather than a guaranteed direction, suggesting consolidation could follow the recent climb.
⬤ Momentum readings beneath the price chart are turning positive after spending time in negative territory. The oscillator curves have crossed upward and histogram bars are shifting green, reflecting better short-term energy. Still, this improvement also means META is entering a zone where it might stall or pull back before committing to a clearer trend.
⬤ META's technical setup matters beyond the stock itself—as a major piece of big-cap tech indexes, how it behaves around these reclaimed levels could shape broader sector sentiment. With AI models playing a bigger role in tactical trading decisions, the stock's action around this forecast zone will likely influence near-term market expectations across technology names.
 Usman Salis


