 Marina Lyubimova

⬤ Meta shares climbed following a strong earnings report, catching the attention of technical traders watching the stock's chart structure. The weekly chart reveals META breaking out of a flag pattern—a setup that typically signals more upside ahead. After weeks of sideways movement, earnings provided the spark that pushed price above the consolidation zone.
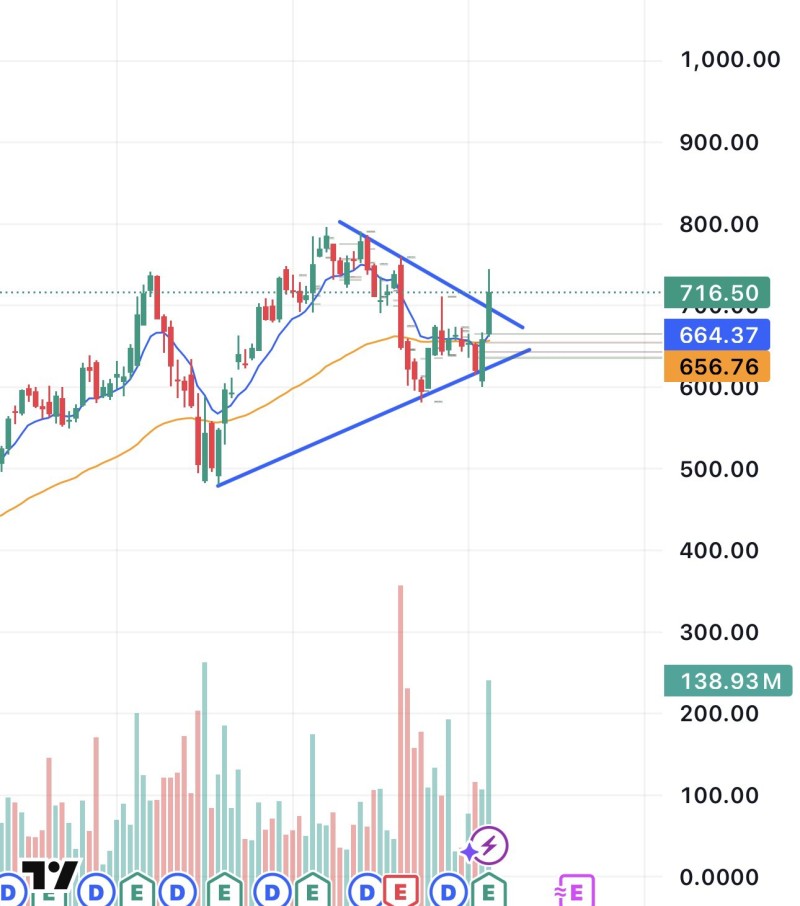
⬤ The weekly timeframe shows META compressing inside a flag formation before this breakout. Price has now cleared the upper edge of that pattern, moving above key levels from the consolidation period. This confirms the broader uptrend is still in play rather than rolling over into a deeper pullback.
⬤ The daily chart adds another layer of support—META is holding the gap created after earnings. That gap acts as a floor, showing buyers are still in control and sellers haven't been able to push price back down. Volume around the breakout zone backs up the move, suggesting genuine follow-through rather than a quick spike.
⬤ What makes this setup interesting is how the weekly breakout lines up with daily gap support. It's not just one timeframe showing strength—it's multiple charts confirming each other. When earnings momentum gets reinforced by clean technical structure like this, continuation moves tend to have better odds of playing out.
 Marina Lyubimova


