 Usman Salis

⬤ Meta Platforms stock completed a key technical objective after filling a price gap left from October 30. The gap in the $740 to $750 region has now been filled, aligning with levels that had been closely monitored. Following the gap fill, META rotated lower, shifting market focus toward the remaining unfilled gap below current price.
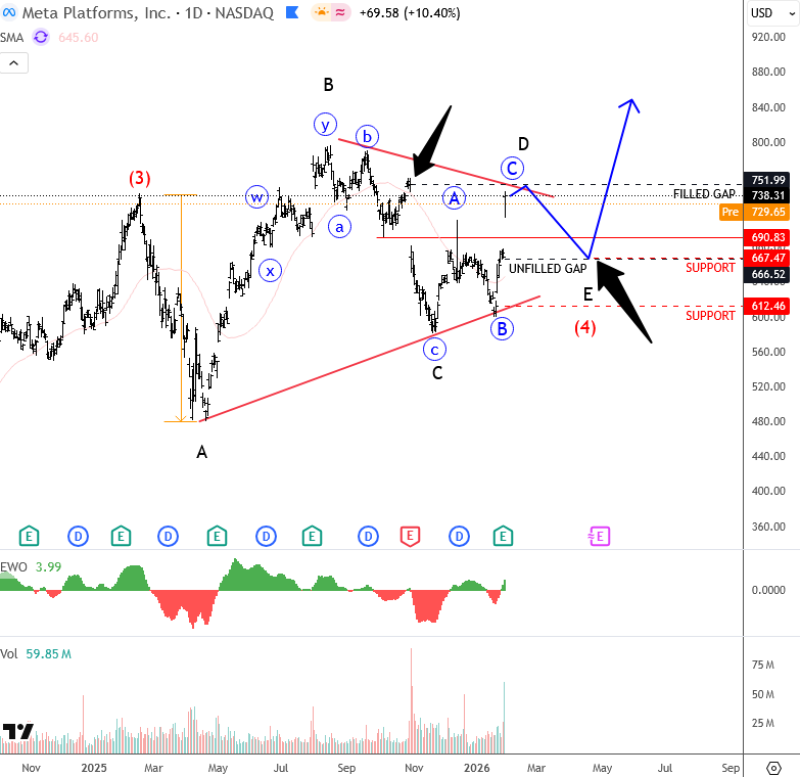
⬤ The chart shows META trading beneath the filled gap area, with resistance now marked near the low $730s. Below that zone, multiple support levels are highlighted around $690, $665, and $612. The unfilled gap sits within this lower region, making it a key reference point as price continues to consolidate. This is framed as part of a broader corrective move rather than a confirmed breakdown, with price action remaining orderly within defined boundaries.
The lower unfilled gap aligns with the lower boundary of this structure, creating a potential area where the correction could complete before a reaction higher.
⬤ The broader structure suggests a developing consolidation pattern, with price swings narrowing into a triangle formation. The lower unfilled gap aligns with the lower boundary of this structure, creating a potential completion zone for the correction. Momentum indicators reflect reduced upside strength compared with earlier advances, consistent with a pause rather than renewed acceleration.
⬤ This setup matters because Meta Platforms is a major constituent of US equity indices and the technology sector. Gap behavior and consolidation patterns in META often influence short-term sentiment across large-cap growth stocks. How price behaves around the remaining unfilled gap and nearby support zones may clarify whether the current pullback resolves as a corrective phase or extends further, shaping expectations for trend development in the weeks ahead.
 Usman Salis


