 Saad Ullah

⬤ Meta Platforms shares are currently working through a consolidation phase after a powerful multi-year run, but the broader price structure remains solid. This is the stage where impatience kicks in—right before the next real opportunity shows up. The chart shows META still respecting its long-term trend while moving through a healthy pullback rather than falling apart.
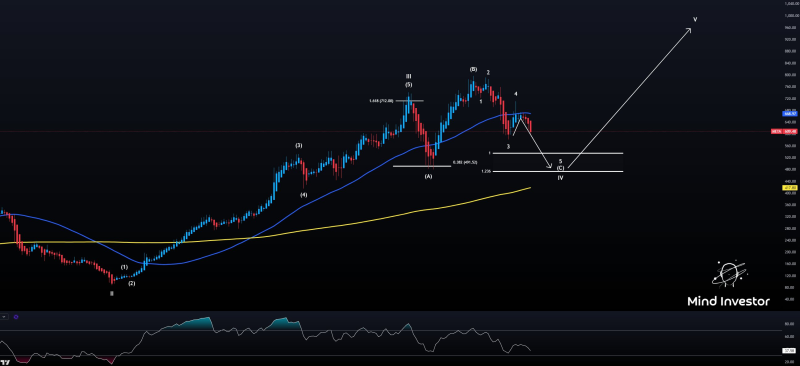
⬤ The technical setup reveals a structured Elliott Wave progression, with earlier impulsive waves already wrapped up and price now navigating a corrective sequence. META has pulled back from recent highs but is holding comfortably above its rising long-term moving averages, which continue to define where this stock wants to go. Horizontal support levels mark a potential zone where the correction could bottom out before the next directional leg kicks in.
This is the stage where frustration often builds, just before a clearer opportunity emerges.
⬤ Momentum indicators show cooling conditions, but that's normal consolidation behavior—not a sign the trend is breaking. Relative strength has eased from elevated levels, matching what we've seen in previous cycles rather than pointing to structural trouble. The chart lays out a potential scenario where the corrective phase completes and a fresh impulsive move takes over, staying in line with the bullish structure that's already in place.
⬤ What happens next matters because it'll determine whether Meta can hold its long-term trend and shift into the next expansion phase. The chart explicitly projects a continuation scenario that could play out once this structure completes, with an upside path stretching toward the $1,200 area later this year if the trend stays intact. These setups typically become obvious during the move itself—not while price is grinding sideways. Right now, the structure is saying stick with the trend instead of reacting to short-term noise.
 Saad Ullah


