 Artem Voloskovets

⬤ Meta Platforms wrapped up the week with a positive technical development, maintaining its position above the 20-week moving average. This weekly close confirms that META likely put in an intermediate-term bottom back in November after several weeks of price correction. The stock has stabilized from its late-2025 pullback and appears to be building momentum heading into 2026.
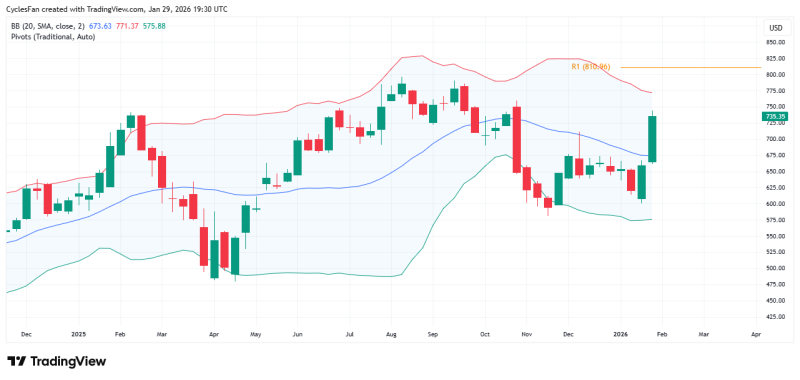
⬤ The chart shows META trading comfortably above its 20-week moving average, a line that's proven reliable for gauging intermediate-term trends. After touching lower volatility bands in November, the stock bounced back and started printing higher weekly closes. Recent price action looks healthy, with META holding firm above this key average instead of falling back into its previous trading range.
⬤ Traders are now watching the first yearly resistance zone around 811. That's the next major technical hurdle standing in the way. Breaking through this level would clear the path toward new all-time highs before anyone needs to seriously consider whether a major market top is forming. Right now, there aren't any structural warning signs, and the price action continues to support the case for further upside.
⬤ This matters beyond just META itself. As one of the biggest technology stocks, META's trend often reflects broader sentiment in growth-oriented equities. When a stock this size holds above its 20-week moving average while approaching a clearly defined resistance level, it tells you the market still has an appetite for risk. If the stock continues respecting this technical structure, it reinforces the idea that November's low was more than just a quick bounce—it was a genuine turning point that keeps higher targets in play.
 Artem Voloskovets


