Peter Smith

⬤ IREN (Iris Energy) is sitting at a critical decision point. The stock's bullish structure stays intact as long as price holds above $33.34 - a red horizontal line on the chart that doubles as both key support and a practical stop-loss reference. Lose that level on a sustained basis, and the odds of another down leg climb sharply.
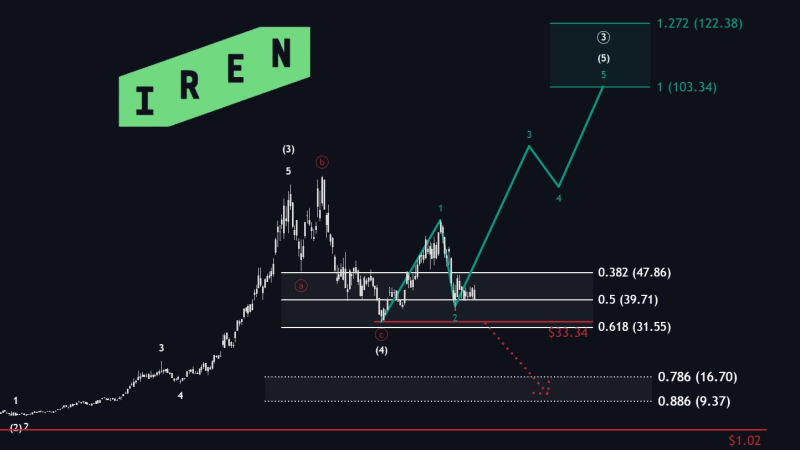
⬤ The chart lays out Fibonacci retracement zones across a projected path, marking where the market could react if the trend holds or breaks. Visible labels on the right show 0.382 at $47.86, 0.5 at $39.71, and 0.618 at $31.55 - with $33.34 pinned just above that 0.618 level as the main support. The bullish scenario assumes IREN holds this zone and pushes higher, following an outlined pathway that builds upward momentum over time.
⬤ The downside case is equally well-defined. A sustained break below $33.34 points toward a dotted target zone lower on the chart, framed by deeper Fibonacci markers at 0.786 ($16.70) and 0.886 ($9.37). The post specifies the likely objective would be toward the upper edge of that zone around $16.70. The same analysis offers a clean risk plan: set your stop "around $33.34" and manage exposure if the setup fails. You can see how Iris Energy's prior $39 double bottom structure fed into this current range.
⬤ What makes this setup worth watching is how cleanly it compresses the whole trade thesis into one invalidation level. When a chart draws both the bullish condition and the failure point this clearly, market attention tends to lock in around that threshold - participants are either watching for a hold and rebound, or a breakdown that accelerates toward lower targets. For IREN, how price behaves around $33.34 is essentially the whole near-term story.
 Peter Smith