 Eseandre Mordi

⬤ Iris Energy (IREN) experienced a significant weekly decline of approximately 16%, yet managed to hold above a crucial technical support zone. Despite the selloff, the stock continues trading within its bull market support band.
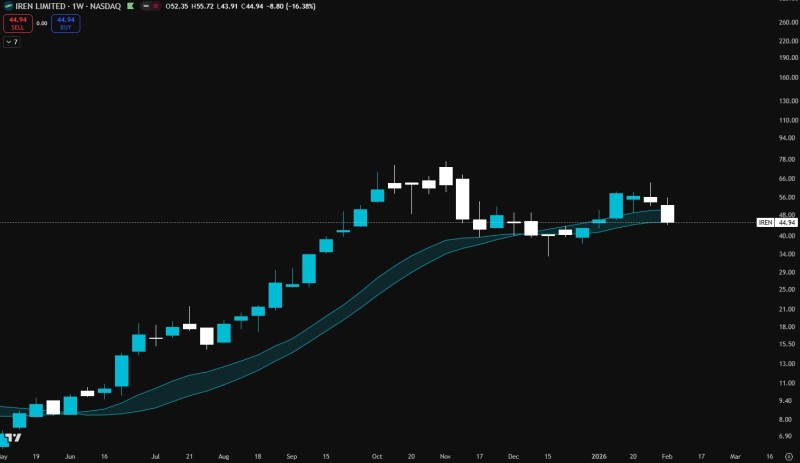
⬤ The chart reveals IREN's steady advance through previous months before entering a consolidation phase. This week's candle dropped into the mid-$40 range, closing around $44.94 after fluctuating between $43.90 and $55.70. This price level coincides with the ascending support band formed by long-term moving averages.
⬤ Price behavior around this zone has historically served as trend confirmation rather than signaling breakdowns. The current structure shows interaction with dynamic support without losing the underlying trend. Chart projections indicate potential continuation toward higher levels while the band remains intact, with an upside target referenced near $96.
⬤ This development matters for market direction because maintaining structural support following sharp declines typically represents consolidation within an uptrend rather than reversal. Holding above the support band preserves the broader bullish framework, while a clean break below would shift IREN's longer-term outlook.
 Eseandre Mordi


