Saad Ullah

⬤ Intel Corporation shares have entered a corrective phase after surging roughly 60 percent over the past month. The stock is now pulling back from recent highs and heading toward a well-defined demand area. After breaking through bullish market structures, the rally became technically overextended, and the 4-hour chart now shows price rolling over following the sharp advance.
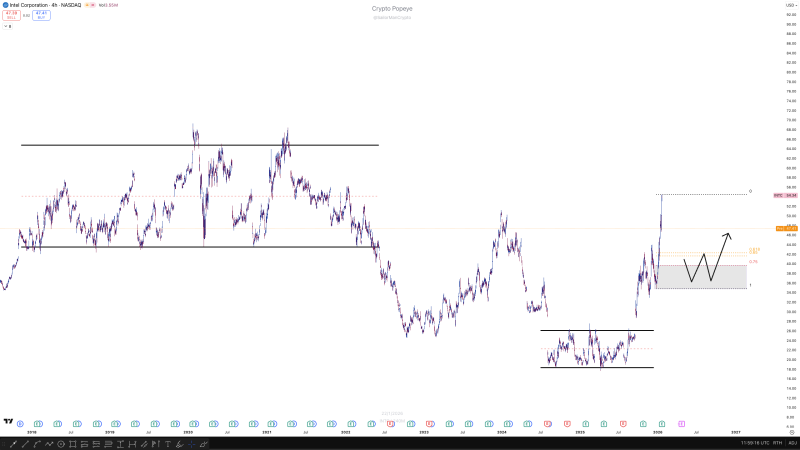
⬤ The chart shows a decisive bullish breakout from a previous consolidation range, followed by an explosive rally that pushed Intel significantly higher in a short timeframe. This rapid move left the stock stretched, making a pullback more likely. Recent weakness, including a noticeable pre-market decline, has brought shares lower but hasn't yet broken the broader bullish structure visible on the chart.
⬤ Price action is now approaching a marked demand zone that aligns with key Fibonacci retracement levels from the recent rally. This area represents where buyers previously stepped in with strength and is the primary zone being watched. At this stage, no entry is suggested as price continues to move within this retracement zone.
⬤ This pullback is significant because it will show whether Intel's recent rally was a sustained structural shift or just a short-term spike that needs consolidation. How the stock behaves around this demand zone will help determine if the broader bullish trend stays intact or if more sideways movement is needed before any continuation higher.
 Saad Ullah