 Marina Lyubimova

Sometimes the best trades come from other people's panic. That's exactly what happened with Google stock earlier this year. When Chrome's market share dipped slightly, traders hit the sell button hard. But those who kept their cool and bought during the chaos are now watching their positions climb as the stock pushes toward new highs.
What the Chart Shows
The price action tells a straightforward story. From May through September, the stock had a strong run that took it past $280. Then came the pullback—nothing unusual for a stock that had just gained that much ground. But here's where it gets interesting: the bounce off support around $220 has been sharp, and now the stock is testing a resistance line that, if broken, usually leads to more gains.
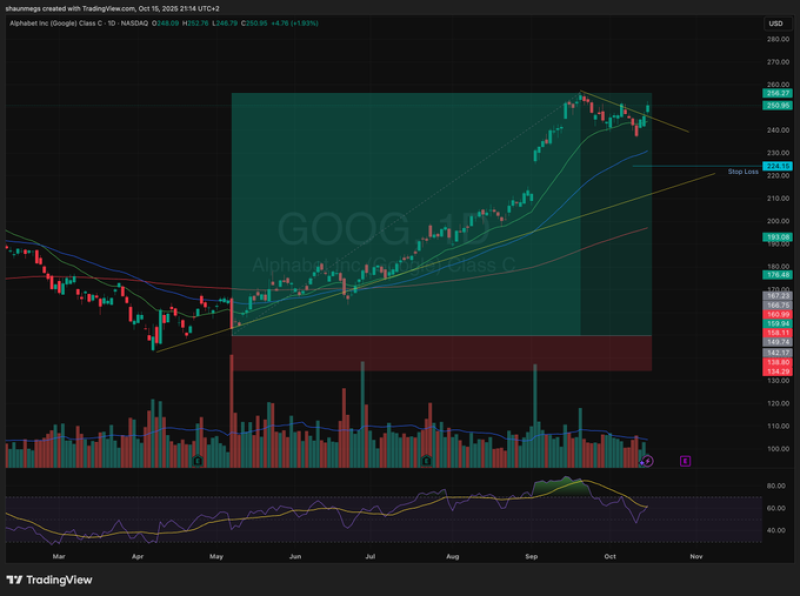
The moving averages are both pointing up, which is what you want to see in a healthy uptrend. The RSI indicator bounced from oversold levels, showing that buyers have come back with real conviction. That support zone near $220 is worth watching—it's where the stock found its footing and where traders have been placing their stops.
Why the Fear Was Overblown
Chrome market share drop was more about headlines than actual business problems. The stock dropped on emotion, not on deteriorating fundamentals. Once people realized the sky wasn't falling, they started buying again. It's a pattern that plays out over and over in markets: short-term fear in a long-term bull trend creates opportunity.
 Marina Lyubimova


