 Marina Lyubimova

⬤ Alibaba Group shares have cooled off after a strong rally, with BABA now retreating from recent highs. The daily chart shows the stock completing what looks like a Wave 1 impulse move before entering this pullback phase. Technical analysts are treating this as a Wave 2 correction rather than a trend reversal.
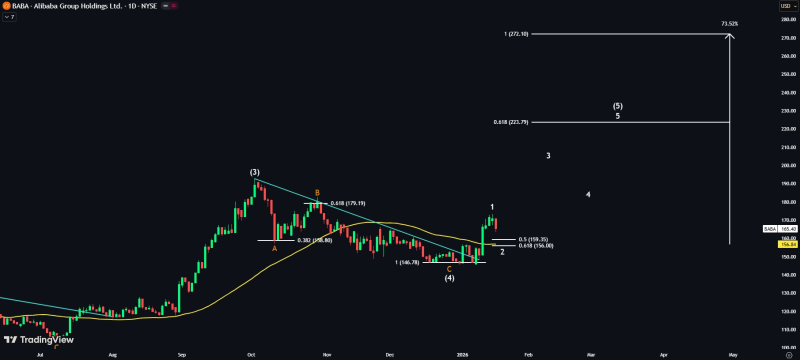
⬤ BABA pushed higher before hitting resistance and turning down into correction mode. The stock is now testing key Fibonacci retracement levels marked on the chart. This fits the classic Wave 2 playbook where price gives back some gains before potentially resuming its upward path. The 50-day moving average sits right in this support zone and could determine whether the pullback ends here.
⬤ The correction zone overlaps with previous support around the mid-$150s. Despite the retreat, BABA remains well above the base it built before the rally, suggesting the bigger picture structure is still holding. If this wave pattern plays out, the chart projects a potential 73% upside move from the current Wave 2 area through a projected Wave 5.
⬤ Wave 2 pullbacks typically act as reset points within larger trends. How BABA behaves around that 50-day moving average will likely signal whether the stock is ready to launch into its next leg up or needs more time to consolidate. This technical crossroads could define BABA's direction for the coming weeks.
 Marina Lyubimova


