 Usman Salis

⬤ AST SpaceMobile took a beating in the latest session, with ASTS plunging over 14% in just one day. The stock, which had been riding high for weeks, suddenly shifted into reverse gear in what became one of its worst single-day performances in the current cycle. The daily chart shows a clear break to the downside, signaling that short-term momentum has completely flipped.
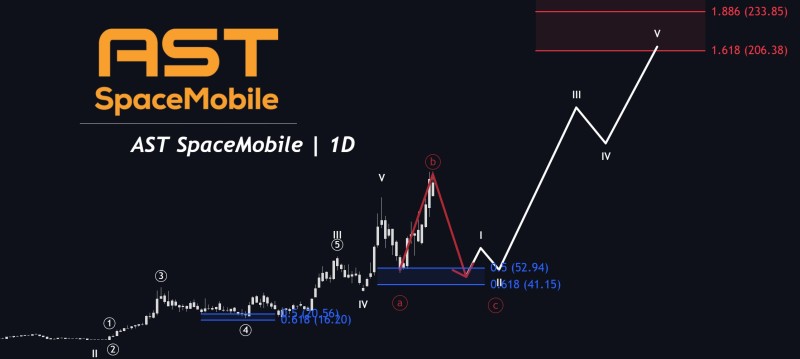
⬤ Before this drop, ASTS had been on a tear, climbing steadily through several strong rallies. The chart shows the selloff kicked in right after price peaked near its upper range, and then things went south fast. Key Fibonacci levels are sitting around the low $50s and low $40s—areas where the stock previously consolidated and could potentially find some breathing room during this pullback.
⬤ Looking at the Elliott Wave patterns on the chart, it appears the stock might be entering a correction phase after wrapping up its earlier upward run. "The sharp daily drop reflects increased volatility, as selling pressure accelerated quickly once downside momentum took hold," notes the technical analysis. The projected path suggests more downside could be coming before any real stabilization attempt takes shape.
⬤ This kind of price action is pretty telling for high-volatility growth stocks in general—what goes up fast can come down just as quickly. AST SpaceMobile's sudden reversal is a perfect example of how momentum can evaporate once a rally loses steam. With that massive 14%+ single-day drop, all eyes are now on whether this pullback deepens or if the stock manages to find its footing after getting knocked down so hard.
 Usman Salis


