 Saad Ullah

⬤ AST SpaceMobile shares have hit the pause button after a strong run-up stalled near $120. The stock met resistance at that level where sellers stepped in, and it's been trading sideways ever since. The weekly chart shows this consolidation taking shape after an extended uptrend—basically, the market's catching its breath rather than pushing higher right away.
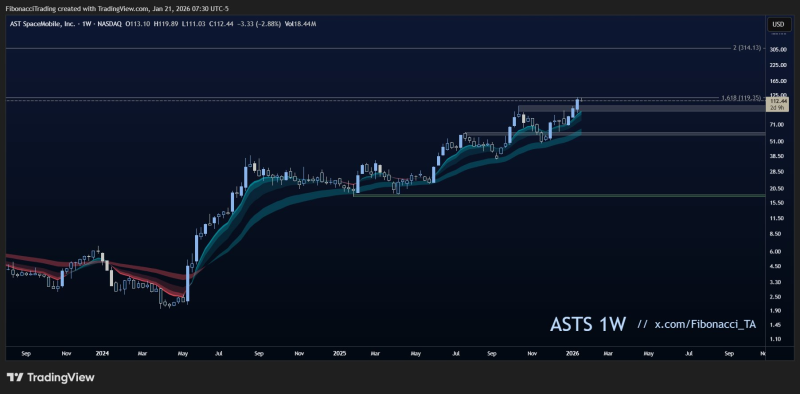
⬤ Here's what's happening on the chart: ASTS built a solid bullish pattern over several months, posting higher highs and higher lows before running into that $120 ceiling. Instead of crashing back down, though, the stock's just hanging out below recent highs. That tells us buyers and sellers are pretty evenly matched at these levels.
Attention is now centered on the $100 to $95 range as a potential area of interest should a pullback occur.
⬤ The $95-$100 zone is what traders are watching now. This area used to be resistance earlier in the rally, and it could flip into support if we get a pullback. On the weekly timeframe, it sits above longer-term trend levels and makes sense as a logical retest zone. Until price drops to test that area, we're basically in wait-and-see mode.
⬤ Why does this matter? This consolidation is setting up the next move for ASTS after its big rally. When stocks pause after hitting resistance, it shapes how they'll move next—whether they'll break out higher or pull back deeper. With ASTS consolidating below $120 and clear support levels marked on the weekly chart, what happens next will show us if this uptrend's got more juice or if it needs a bigger correction first.
 Saad Ullah


