 Saad Ullah

Amazon's steady climb just hit a wall. After months of rising prices since spring, AMZN has cracked below its key support line - the first real breakdown we've seen in a while. The technical picture has clearly shifted, and everyone's watching to see if this is just a minor stumble or something bigger.
AMZN Chart Analysis: The Break Everyone's Talking About
Trading analyst Flux Charts flagged this breach and wondered if sellers will now pile on to push the stock even lower.
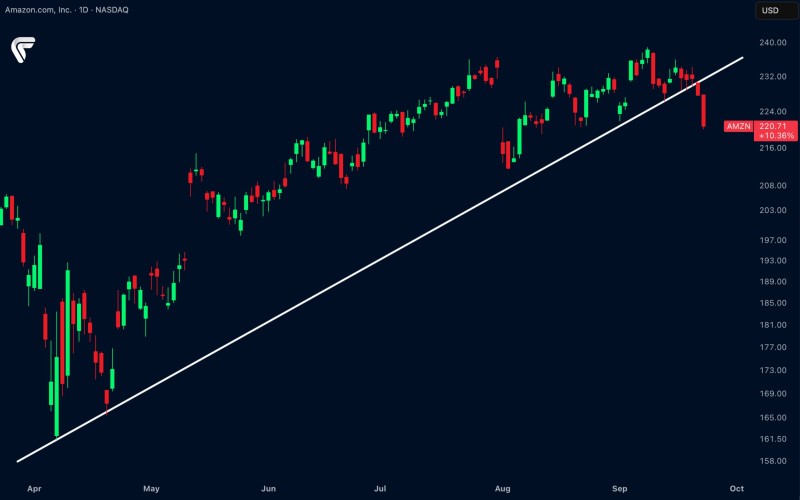
The daily chart tells the story pretty clearly:
- Support Breach: That rising trendline from April? It's broken, and that's not good news for bulls
- Price Action: AMZN dropped below $224 and closed near $220 - its weakest showing in weeks
- Fading Momentum: We saw lower highs building up before the break, hinting that buyers were already losing steam
This breakdown could be the start of something bigger if the stock can't find its footing soon.
Why Amazon Is Stumbling
September's always a tough month for stocks, and Amazon isn't immune to the broader market jitters around Fed policy and economic data. After rallying hard through the first half of the year, AMZN hit some pretty stretched valuations - and now profit-taking seems to be kicking in. It's not just Amazon either. The whole tech sector is cooling off, with Microsoft and Alphabet also showing weakness. Sometimes it's not about the company - it's about the sector.
The immediate battle zone is $216-218, which could provide short-term support. But if that fails, the psychological $200 level becomes critical - that's where things could get really interesting. On any bounce, that former trendline around $225-227 will now act as resistance, making any recovery tougher.
 Saad Ullah


