Sergey Diakov

⬤ Advanced Micro Devices Inc. (AMD) is trading near the upper end of its recent range on the weekly chart after rebounding from the $200 area. Price recently closed around $259, holding above former resistance levels. The weekly structure shows reinforcing momentum, staying constructive as long as price remains supported above prior breakout zones.
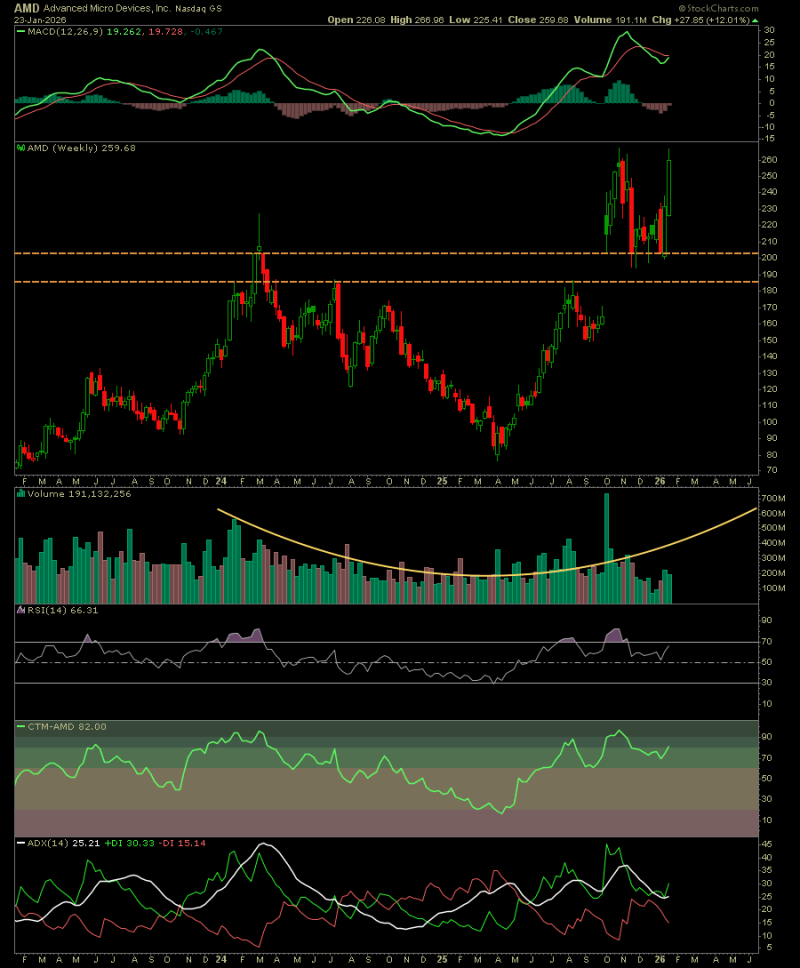
⬤ The chart displays a clear trend shift after AMD completed a prolonged consolidation phase. Once price broke above the $190-$200 region, upside momentum accelerated through a sequence of higher highs and higher lows. Weekly MACD remains positive, pointing to sustained momentum rather than a short-term spike. Current price action suggests consolidation within strength rather than reversal.
⬤ Volume behavior supports the move. After declining during consolidation, volume has expanded as price pushes higher—typical of trend continuation. Weekly RSI sits elevated but not extreme, showing strong momentum without clear exhaustion signals. Chart markings highlight higher reference zones at $272, $284, and $291 as potential targets if momentum stays intact.
⬤ This setup matters for the broader market because AMD serves as a key semiconductor proxy for technology sector strength. Sustained stability above former resistance can influence sector sentiment and reinforce trend confidence across related equities. How AMD behaves near these higher reference zones will determine whether the current momentum phase extends or consolidates further.
 Sergey Diakov