Usman Salis

⬤ Advanced Micro Devices continues trading firmly near recent highs, with the daily chart revealing persistent upward momentum. The current price structure demonstrates strength that emerged after several months of accumulation starting in 2025, defying widespread bearish sentiment that dominated earlier in the cycle.
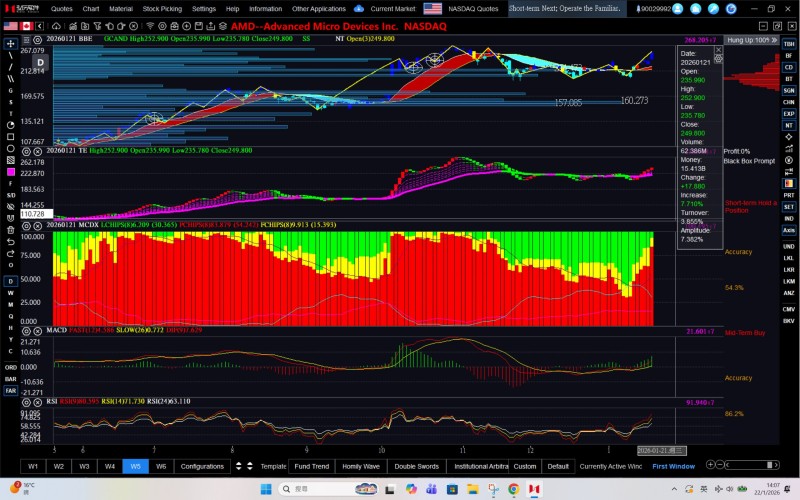
⬤ AMD now trades in the upper $240 range following a steady climb from substantially lower levels. The chart displays a clear pattern of higher highs and higher lows, reinforced by multiple technical indicators and ascending trend structures. The expansion of the red ribbon indicator—historically associated with renewed upside momentum—continues to hold. Rather than pulling back sharply, price has consolidated near elevated levels, strengthening the prevailing trend.
⬤ Momentum indicators remain constructive, signaling sustained participation beyond short-term surges. Previous pullbacks have stayed shallow, with support forming before any significant declines could develop. AMD has stayed well above the $162-$170 zone mentioned in earlier analysis, which hasn't been tested during this advance. This pattern highlights persistent buying interest at progressively higher price levels.
⬤ This technical setup carries weight because AMD's ability to sustain strength near record territory influences sentiment across the semiconductor sector. Prolonged uptrends in major technology stocks often shape expectations around sector leadership and broader market momentum. While the current structure holds, AMD's price action serves as a key reference point for trend durability and positioning within the technology market.
 Usman Salis