 Marina Lyubimova
⬤ AMD has surged higher on the weekly chart, currently trading around $242.39 after a strong multi-month rally off mid-2025 lows. The stock is now approaching the upper boundary of a long-standing rising channel, with multiple trendlines and Fibonacci levels marking previous turning points throughout its broader cycle. Many traders are watching to see if the stock will pull back to lower levels, offering another potential entry point after this rapid advance.
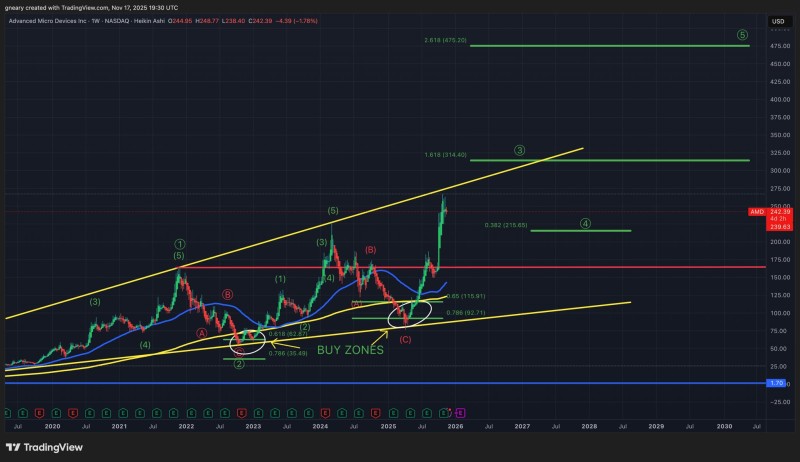
⬤ The technical structure reveals AMD's multi-year Elliott wave pattern, spanning from 2020 through 2025. Historical buy zones are clearly visible, including the 0.618 retracement level near $62.87 and the 0.786 region around $35.49, where the stock previously found strong support. Another significant support cluster appears near $92.71 and $115.91, marking the base that preceded the current rally toward the channel's upper trendline.
⬤ AMD is currently trading above the 0.382 Fibonacci level at $215.65, with long-term upside projections targeting the 1.618 extension near $314.40 and the 2.618 level around $475.20. The stock cleared a major horizontal resistance zone around $175 earlier in this rally, and the steep recovery from mid-2025 lows demonstrates strong momentum within the broader channel structure. This price action has sparked widespread interest in whether AMD might revisit earlier support areas before continuing higher.
⬤ This setup carries weight because AMD's sharp move from well-defined accumulation zones into the upper portion of its long-term trend could influence sentiment across the semiconductor sector. The presence of multiple historical support regions and Fibonacci structures provides a clear roadmap of how the market has responded during previous corrections. As AMD continues moving within this expanding cycle, the interaction between current price levels and major structural boundaries will likely shape expectations around future pullbacks and consolidation phases.
 Marina Lyubimova


