 Usman Salis

⬤ AMD is tracking a bullish Elliott Wave sequence that's expected to play out in five swings from the April 2025 low, as long as the stock holds above the September 2025 pivot. The weekly chart shows this upward structure still in motion, with the April low serving as the foundation for the current rally. The trend stays constructive as long as AMD doesn't break below that September level.
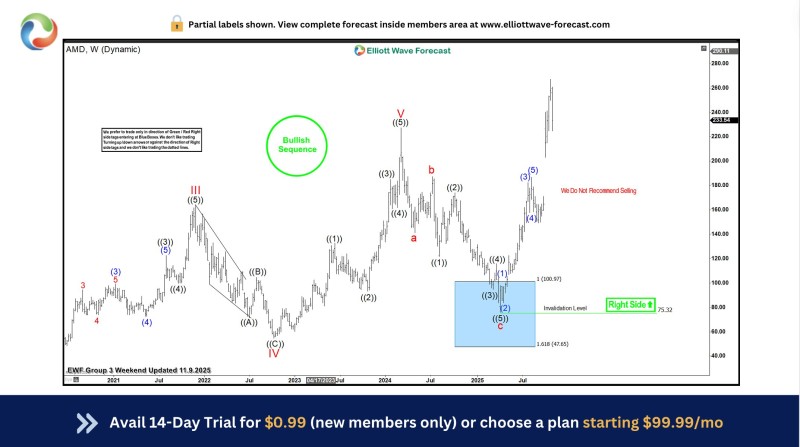
⬤ From a technical standpoint, the main risk is straightforward: if AMD drops below the September 2025 low—clearly marked on the chart—it would break the bullish structure and likely trigger heavier selling. That would invalidate the five-swing bullish forecast and shift momentum to the downside.
⬤ AMD's pullbacks are expected to unfold in three, seven, or eleven swings and should find support above the November 2025 low—and more importantly, above the September 2025 low. The chart highlights a large blue support zone near the 100–75 range, where buyers are expected to step in. The annotation "We Do Not Recommend Selling" reflects confidence that the bullish pattern will hold.
⬤ For now, AMD's Elliott Wave setup suggests it could remain one of the stronger semiconductor plays as long as those key support levels stay intact. Holding above the major pivots would confirm the structure is solid, while breaking below them could flip sentiment and kill the bullish outlook. Traders will be watching upcoming pullbacks closely to see if they match the expected swing counts and respect those critical support zones.
 Usman Salis


