 Peter Smith

AMD's been on a tear lately, climbing from $150 to around $255 over the past several months. But after hitting the upper boundary of its long-term rising channel, the stock seems to be catching its breath.
The Technical Setup
A recent chart from MeatballTrades shows a clear rejection at resistance—similar to what happened earlier in 2024—and now traders are watching to see if AMD will pull back to the $220 level, where previous reversals have occurred.
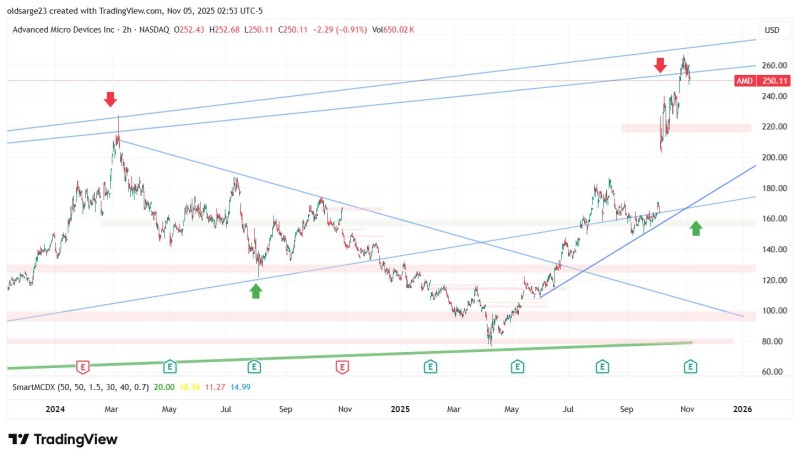
AMD's chart shows a textbook rejection from the top of its ascending channel near $255–$260. That level has acted as a ceiling before, and this time was no different—a sharp rejection candle followed by weakening volume suggests momentum is fading. Here are the key levels traders are watching:
- Resistance (rejected): $255–$260 — upper channel boundary and psychological ceiling
- Intermediate support: $240 — short-term consolidation zone
- Major support: $215–$225 — high-volume area with prior reversals
- Trendline support: $160 — long-term uptrend line from early 2024
The $220 zone is especially important. It's where AMD bounced several times in October, and if it holds there again, the uptrend likely stays intact. If it breaks below $215, though, things could get messier with a potential drop toward $180–$190.
What's Behind the Pullback?
AMD's recent earnings beat expectations, but the forward guidance for its data center business was only moderate—not exactly fireworks. After a 60% run in six months, some profit-taking makes sense. Add in rising Treasury yields and rotation out of high-beta tech stocks, and you've got a recipe for a cooldown.
The broader channel is still bullish, so this could just be a healthy pause rather than a trend reversal. If AMD holds above $220, it could bounce and head back toward $260–$270. But if it breaks below $215, expect a deeper correction toward $180. Either way, $220 is the line in the sand—where buyers either show up or step aside.
 Peter Smith


