 Alex Dudov
⬤ Apple shares took a hit as multiple headwinds converged with a broader tech sector retreat. The sell-off was triggered by news that an AI Siri update has reportedly been delayed until May, alongside rising memory costs, FTC regulatory pressure on the news app, and general weakness across technology stocks. On the weekly chart, AAPL continues to trade within a well-defined range between roughly $243 and $284.
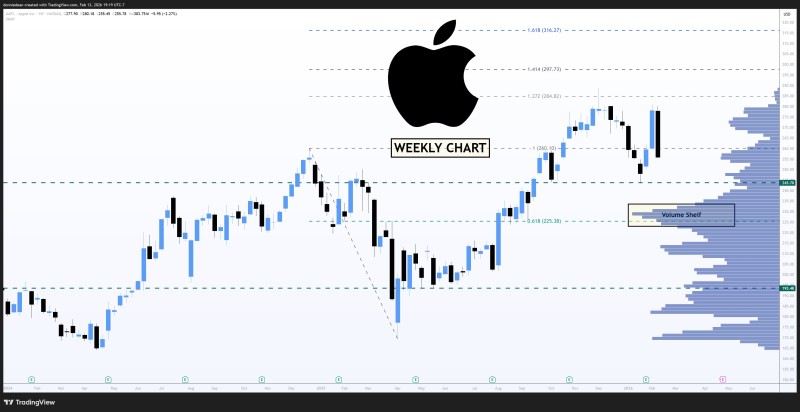
⬤ After approaching the upper end of that band, price action has now reversed and drifted back toward the lower boundary near $243. The chart reveals a significant volume profile "shelf" in the mid-to-lower section of the range—a zone where trading activity has historically concentrated and price tends to find support or resistance. Recent TheTradable coverage has examined this type of weekly structure, including AAPL price analysis at $248 support and AAPL drops 10% from peak, both focusing on key support levels during pullbacks.
⬤ "The sell-off was linked to an AI Siri update reportedly pushed back to May, high memory costs, regulatory pressure on the news app from the FTC, and broad technology sector weakness." Looking at overhead targets, the chart shows Fibonacci extension levels near $297.73 and $316.27, while the range ceiling holds around $284. The weekly view signals consolidation: AAPL hasn't broken above resistance, but it's also managing to stay within the established band as news-driven volatility unfolds. A similar focus on weekly patterns and resistance zones appears in AAPL stock weekly sell signal.
⬤ This setup matters because AAPL is trading at a critical intersection of headline risk and technical structure. The $243 to $284 range represents how the market is currently pricing AI-related timing issues, regulatory concerns, and sector momentum. Whether Apple holds the lower boundary or bounces back toward the middle of the range will determine how the next phase of price action develops within this weekly framework.
 Alex Dudov


