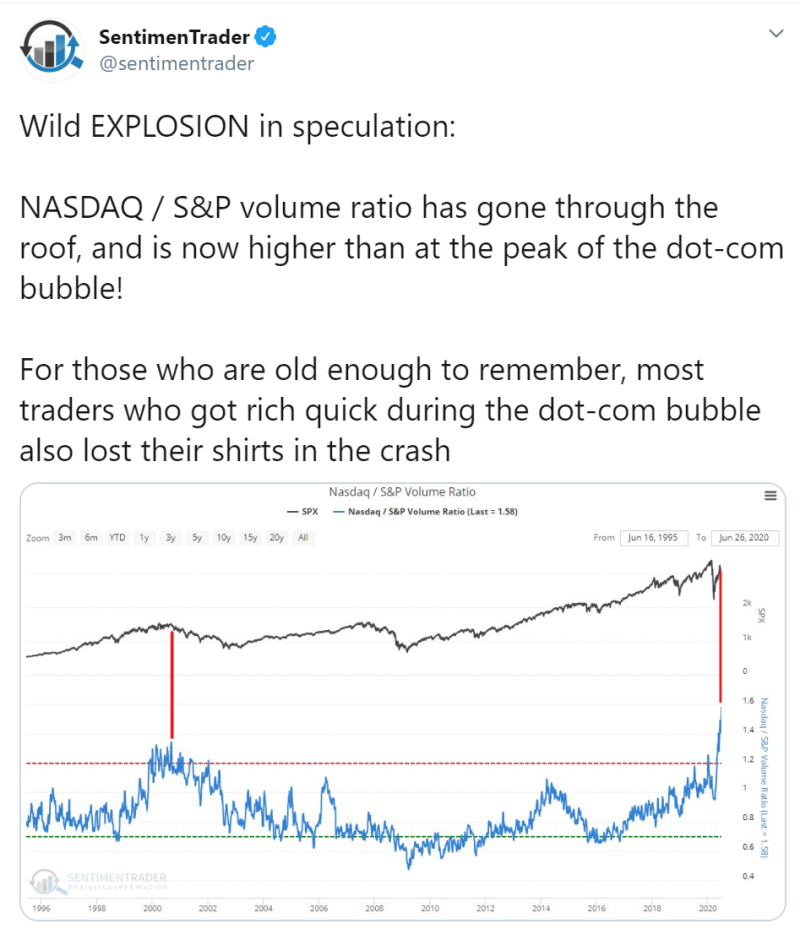
Sundial Capital Research, a group of authoritative investment researchers, consultants and analysts with extensive background, noticed how volume of trades on the Nasdaq has drastically increased these days in contrast to S&P 500 trades. This graph demonstrates a comparison between the S&P 500 and S&P 500/Nasdaq ratio.

If the distance between the two lines decreases, it indicates that the trading volume on Nasdaq is growing faster than the one on S&P. According to the experts, this fact might be one of the signals of bubble growing on the stock market. Recalling similar situation 20 years ago, they warn that despite many people earning much while the bubble was growing, they ended up losing everything, when the bubble burst.
However, this analytical standpoint hasn't received unanimous support. A well-known investor, Eric Jackson, the founder and the president of EMJ Capital, Ltd, suggested that such ratio of two indexes could be a consequence of investors' rational behavior, who simply consider Nasdaq stocks better.

The Nasdaq Composite and the S&P 500 are two of the most popular equity indexes in the U.S. The Nasdaq Composite is heavily allocated towards top-performing industries, such as Technology, Consumer Services, and Health Care, while the S&P 500 better reflects the economy as a whole. Such allocation towards top-performing industries usually helps the Nasdaq to outperform the S&P 500 by large.
Jesse Felder, has recently made a statement that goes along with the Sundial Capital Research's conclusions. Despite Felder's fears, increasing gap between price of the S&P 500 Index and the total profit of U.S. companies serves as undeniable evidence of the growth of the largest bubble in history.He also drew parallels between the current market situation and the Dotcom bubble crash.
 Usman Salis

 Usman Salis


