Saad Ullah

⬤ The S&P 500 ETF (SPY) just pulled off something interesting on the monthly chart—it broke above its old all-time highs but couldn't hold onto those gains through the close. That's left what technical analysts call a "fakeout candle" sitting right at the top. SPY pushed past previous records during the month but ended up finishing below that breakout level, which has people wondering if we're about to see some downside action.
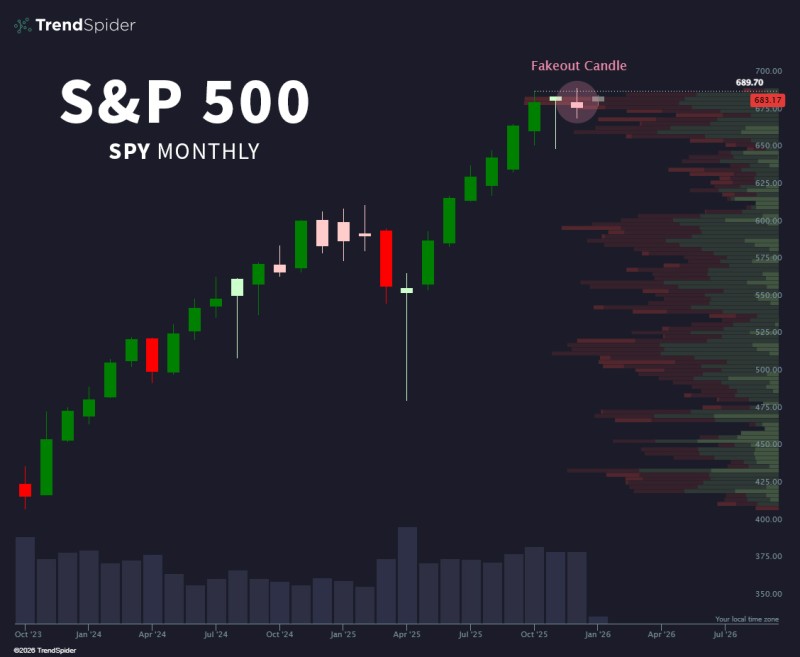
⬤ Right now, SPY is trading around 683, down from the 689.70 peak it briefly touched before reversing course. The monthly candles show a solid uptrend leading into this zone, then that reversal pattern right at the high point. The volume profile on the chart shows most of the heavy trading happened at lower levels, marking where the market consolidated on its way up. That rejection near the highs is what's catching everyone's attention.
⬤ The big question now is whether SPY is setting up for a pullback this month. When price breaks above resistance but then closes back under the previous high, it often signals a failed breakout. The long-term uptrend is still intact on the monthly timeframe, but failing to hold near record levels adds a note of caution, especially with valuations where they are.
⬤ This matters because the S&P 500 is the most-watched equity benchmark on the planet. How it behaves at record levels shapes broader market sentiment, particularly when you get a reversal pattern right after testing new highs. Traders will be watching closely to see if this is just consolidation at the top or the early stages of something more significant.
 Saad Ullah