 Usman Salis
⬤ A key long-term valuation gauge for U.S. stocks just flashed a rare warning signal. The S&P 500 Shiller Price-to-Earnings Ratio climbed above 40, now sitting at roughly 40.04—a level that's only been touched once before in more than 100 years of market history. This puts today's stock market in seriously expensive territory.
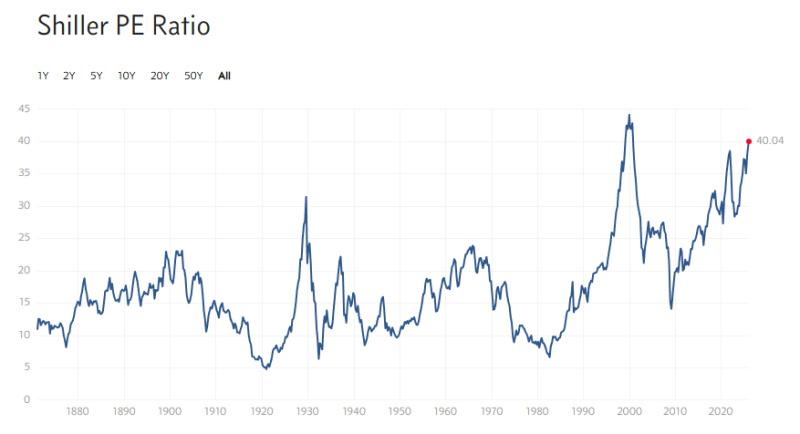
⬤ The Shiller PE works by averaging inflation-adjusted earnings over ten years, which smooths out the noise from business cycles and short-term earnings swings. Looking at the historical chart going back to the late 1800s, you can spot major valuation peaks at the 1929 crash, the late 1960s bubble, and the infamous dot-com mania of the late 1990s. Each time valuations got this stretched, markets eventually cooled off and spent years working through the excess.
⬤ The current surge tells an interesting story. Valuations have been climbing steadily since the 2009 recovery, then really took off after 2020 and haven't looked back. While the Shiller PE has hung above its long-term average for extended stretches before, actually breaking through 40 is exceptionally rare. What makes this moment stand out isn't just how high the number is—it's how long it's been staying up there compared to past cycles.
⬤ Why does this matter for your portfolio? When the Shiller PE hits these extreme levels, stocks become much touchier about earnings disappointments, interest rate moves, and economic hiccups. We're now sitting at a valuation level last seen during one of history's biggest speculative frenzies. The chart makes it crystal clear: stocks are stretched way beyond historical norms, and valuation risk is front and center in today's market conversation.
 Usman Salis


