 Marina Lyubimova
⬤ The S&P 500's valuation is catching attention again as the Shiller P/E ratio pushes toward levels we've only seen during major economic shifts. Howard Marks recently pointed out something interesting: when the market has traded around 23 times earnings in the past, the following 10-year returns have consistently landed somewhere between plus 2% and minus 2%. Right now, we're sitting near 25 times earnings, which has some people worried that returns adjusted for inflation could actually go negative. The chart shows the Shiller P/E at one of its highest points in over a century.
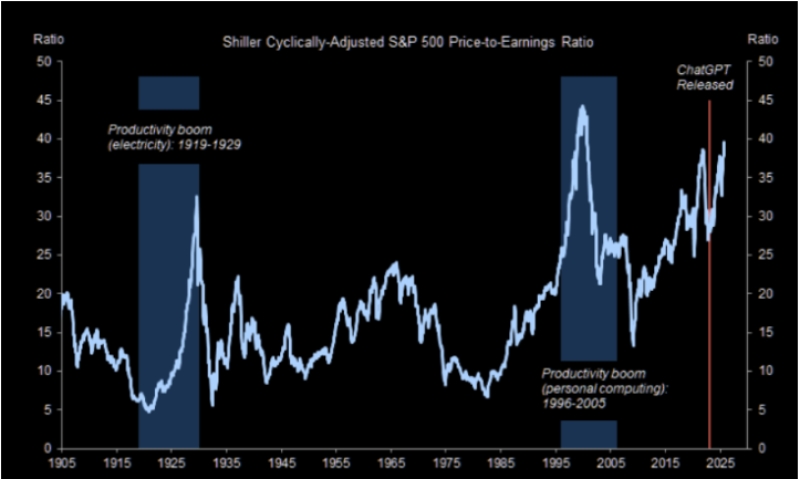
⬤ Looking at the chart, today's situation sits alongside two earlier productivity booms: the electricity revolution from 1919 to 1929 and the personal computer wave from 1996 to 2005. Both times, the Shiller P/E shot up before eventually coming back down. There's also a marker showing when ChatGPT launched, highlighting how today's AI story echoes these earlier tech breakthroughs. While we're still a bit below the late-1990s peak, we're way above the long-term average.
⬤ The rising Shiller P/E shows a growing disconnect between stock prices and actual earnings power. Excitement about AI-driven efficiency has pushed stock multiples higher, but history suggests these stretched valuation periods tend to snap back eventually. With the ratio now well above most historical readings, we're in familiar territory—moments when optimism about future productivity pushes valuations to extremes.
⬤ This matters because extreme valuations have often been followed by adjustments in what investors can expect and shifts in market mood. When multiples climb much faster than earnings, even modest inflation can eat into real returns. By comparing today's AI boom with earlier productivity eras, the chart shows how elevated valuations might shape the market's direction over the coming years.
 Marina Lyubimova


