 Eseandre Mordi

⬤ The S&P 500 (SPX) opened with a gap straight into major resistance area near 7000. Price pushed up initially before forming a topping tail on the 15-minute timeframe, showing sellers stepping in right after the open.
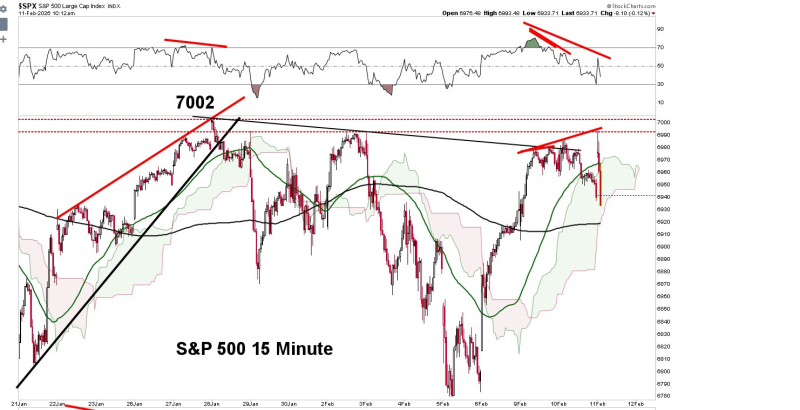
⬤ After getting rejected, SPX flipped negative and pulled back toward the opening level. The chart shows the whole sequence—price ran into resistance, stalled out, then reversed. That killed the early bullish vibe and pulled price back inside the previous range instead of breaking out.
⬤ The intraday setup now depends on whether this plays out as a gap and trap or a full gap fill. After that rejection candle hit, the index kept sliding lower and filled the opening gap, confirming buyers couldn't hold the breakout attempt.
⬤ The price action shows how sensitive SPX is around overhead supply zones, where rallies into resistance just couldn't stick. The reaction demonstrates how opening gaps can flip fast once price meets established resistance, especially when there's loss of upside momentum. Short-term direction now hinges on whether buyers can reclaim control above that same 7000 zone or if sellers keep pressing lower.
 Eseandre Mordi


