 Victoria Bazir

⬤ The S&P 500 has pushed its way up to around the 6,930 level on the daily chart, getting close to previous record highs. Throughout December, the price action has been steadily climbing with solid trading volumes backing the move—clear evidence that traders are actively participating in this rally. This run-up comes after the index recovered from earlier weakness and shows that confidence in U.S. large-cap stocks remains strong.
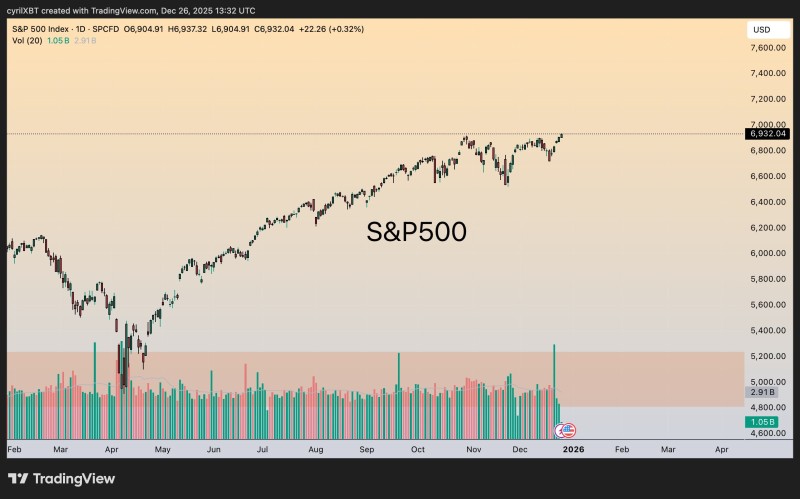
⬤ Three major themes are driving the current market environment: the ongoing push toward new highs, a well-defined bullish trend, and consistent liquidity support. The chart tells the story clearly—higher highs and higher lows have been the pattern for months now. Sure, there've been some pauses and sideways stretches along the way, but the overall direction keeps pointing up, showing that demand for equities isn't letting up.
⬤ That said, risk hasn't vanished from the picture. It's still out there, possibly just moving around between different sectors or asset classes. While the S&P 500 trend looks solid, the underlying economic and financial conditions are constantly shifting, which means things could change quickly if circumstances shift.
⬤ Why does this matter? The S&P 500 acts as the barometer for global equity sentiment and expectations about the U.S. economy. When it holds near or above previous highs, it reinforces confidence in corporate earnings and economic strength. At the same time, it raises questions about valuations, where liquidity is concentrated, and whether this rally can keep going long-term. How well the index holds these levels will be crucial as traders watch liquidity flows and macro developments unfold.
 Victoria Bazir


