 Saad Ullah

⬤ The S&P 500 has stayed in place for forty years and still gives steady profits even when markets turn rough. From 1980 onward the index has gained about twelve percent each year while at some point during almost every year it has fallen about fourteen percent. Records show that brief drops have again and again been followed by a strong finish for the full year - short term weakness seldom spoils the wider view.
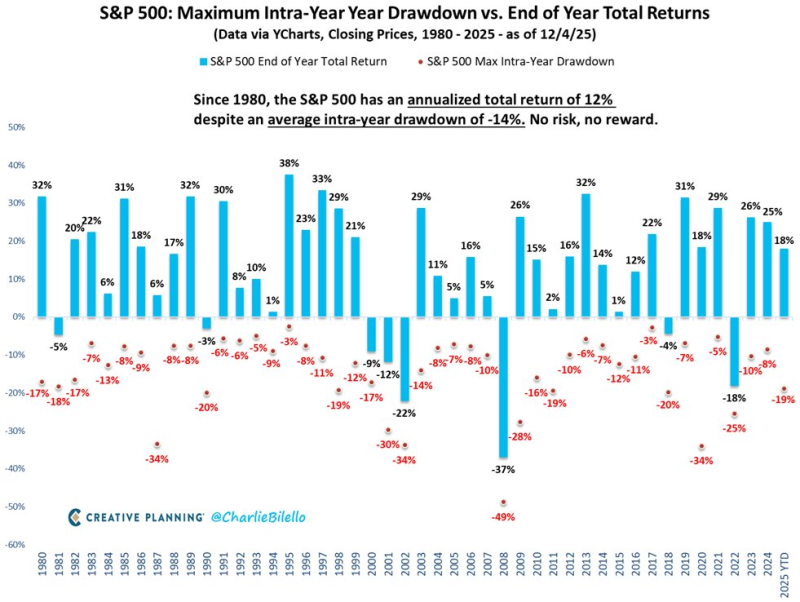
⬤ Some of the clearest cases show huge reversals inside a single year. In 2009 the index sank twenty eight percent yet rebounded to end the year up twenty three percent. The 2020 pandemic crash brought a harsh thirty four percent slide, but the S&P 500 still closed the year up sixteen percent. More recently 2023 plus 2024 each posted double digit pullbacks of ten percent and twenty five percent - yet ended with gains of twenty six percent and twenty five percent. Even harsh years like 2002 and 2008 served as key stages in longer market cycles.
The S&P 500 has produced an average annual return of twelve percent since 1980 while enduring an average intra year decline of fourteen percent.
⬤ The same pattern appears across decades - volatility arrives together with strong performance. Years with pullbacks above twenty percent have shown up often - yet gains of twenty percent or more have also appeared including standout years like 1995 with a thirty eight percent rise and 2013 with a thirty two percent rise. So far in 2025 the index has risen eighteen percent from the start of the year but also has already dropped eight percent along the way - the old rhythm of brief setback followed by eventual recovery continues.
⬤ The figures matter to investors because they underline the S&P 500's capacity to endure storms and finish ahead. The pairing of large intra year losses with strong long term gains still frames how traders and analysts view risk, volatility cycles as well as the long run behaviour of large cap stocks.
 Saad Ullah


