 Saad Ullah

⬤ Market concentration in U.S. equities has reached its most extreme point in 22 years. The ratio of the S&P 100 to the S&P 500 now sits at 0.50, meaning the largest 100 companies are pulling away from the rest of the index at a pace we haven't seen since the early 2000s. The chart tracking this metric shows a sharp climb, particularly in the highlighted recent period.
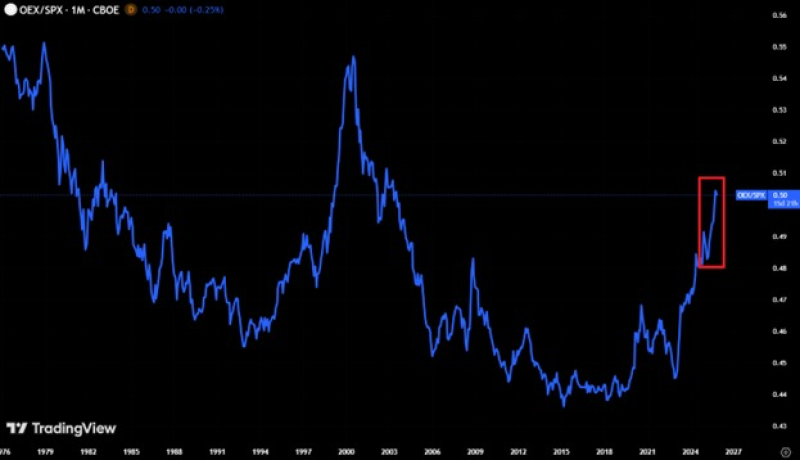
⬤ Over the past three years, the S&P 100 has surged +109%, while the broader S&P 500 gained +83%. That's a significant gap. This pattern resembles the late-1990s tech boom, when the ratio jumped about 0.10 points and neared a record of 0.55. At the current pace, the ratio could reach that 2000 peak again in roughly a year if megacap outperformance continues.
⬤ When a handful of megacap stocks drive most of the market's gains, it creates risks. Broader participation weakens, and a stumble by just a few dominant names can trigger outsized pullbacks across major indices. This kind of concentration erodes diversification benefits and makes the market more vulnerable to sudden reversals.
⬤ For investors, the takeaway is clear: the market's performance is increasingly tied to a shrinking group of companies. That amplifies both potential gains and potential losses. As concentration returns to historic highs, understanding how megacap dominance shapes market behavior becomes more important than ever.
 Saad Ullah


