 Usman Salis

⬤ The U.S. Dollar Index (DXY) flipped to downside momentum after failing to hold gains near the 100 resistance level. Dark cloud cover candlestick pattern formed following last week's attempted breakout, flagging clear distribution pressure from sellers. The next session confirmed the reversal with a close below that candle's low — validating a pivot high.
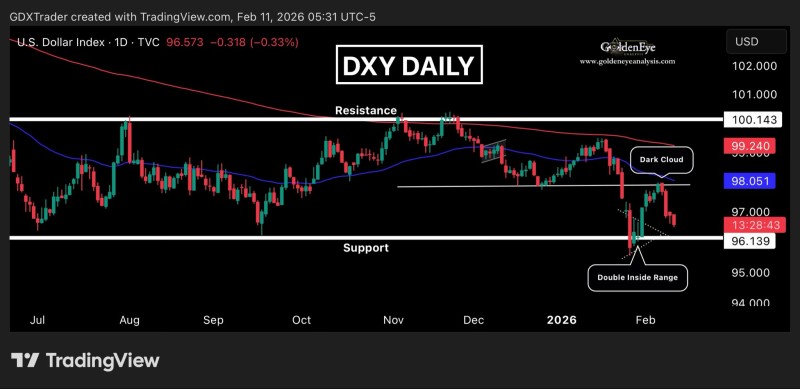
⬤ The chart shows repeated rejection near resistance followed by back-to-back bearish continuation candles. Price has now dropped toward a horizontal support area around the 96 level — a floor that has held for months. That same dynamic was covered in Dollar Index pulls back from 99.50 resistance.
⬤ Market structure reflects sustained selling pressure as buyers have consistently failed to reclaim control. Comparable bearish setups were outlined in DXY bearish structure deepens toward 95.04.
⬤ How price reacts at the 96 support zone will likely set the tone for the next phase. A hold here could trigger another rebound attempt. A clean breakdown, however, would signal broader weakness across currency markets and potentially accelerate further downside.
 Usman Salis


