 Marina Lyubimova

⬤ The U.S. Dollar Index hit a wall near its recent peaks, with the 1-hour chart showing clear rejection from the weekly high zone between 99.50 and 99.60. After climbing higher within what's been a broader bullish pattern, DXY couldn't hold its ground above this level and has started sliding lower. While the overall trend remains bullish, the rejection from this weak high has created an opportunity for short-term selling pressure from these elevated prices.
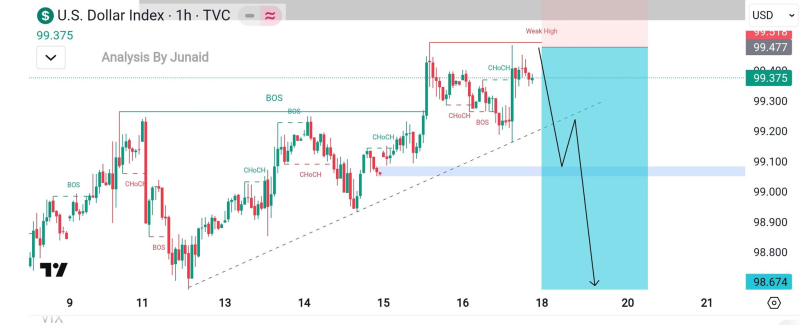
⬤ The chart shows a series of bullish structure breaks earlier in the move, but multiple character changes appeared near the top. This shift signals that the upward push has run out of steam near resistance. Price is now heading back toward an ascending trend line that's been acting as dynamic support during the recent rally. The first key level to watch on the downside sits near 99.30, where this trend line meets previous price structure.
⬤ If the trend line around 99.30 gives way, several downside targets come into play. Breaking below this support would put the psychological 99.00 level in play, with a deeper drop potentially reaching 98.60 as the next major target. These levels line up with earlier price reactions and liquidity zones visible on the chart, making them significant points in the current market structure.
⬤ This matters because the Dollar Index affects everything from currencies and commodities to broader risk assets across global markets. A pullback from the weekly high could take some pressure off recent dollar strength and shift the near-term market mood, while holding above support would keep the bullish structure intact. With DXY sitting at these critical technical levels, how price behaves here will likely shape short-term sentiment and market volatility.
 Marina Lyubimova


