 Usman Salis

⬤ Coffee prices are catching serious attention as COFFEE pushes toward historically critical levels that haven't been tested in decades. The 50-year chart shows a massive rounded base and a clean break above a long-term trend line that held for years. This kind of technical setup doesn't happen often, and when it does, it tends to mark the start of something bigger. The chart suggests soft commodities might be entering a completely new phase.
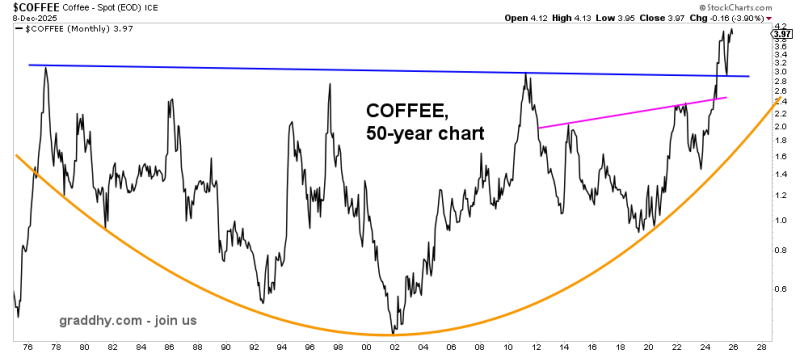
⬤ Central banks like the Federal Reserve have a long track record of managing expectations rather than laying out their actual plans. Combine that with consistently upbeat messaging across mainstream outlets, and you get a narrative that inflation is under control. But commodity markets often tell a different story. The chart highlights a previous breakout and successful retest of a 12-year inverse head and shoulders pattern. That's not the kind of price action you see in a deflationary world. Coffee's current position raises real questions about whether the official inflation story holds up.
⬤ Here's what stands out: nominal coffee prices today are roughly where they were 50 years ago. That makes no sense when you factor in decades of demand growth, currency expansion, and tighter supply chains. It suggests these goods have been underpriced for a long time, and the market may finally be correcting that. If coffee is resetting to reflect real-world fundamentals, other agricultural commodities could follow.
⬤ Agricultural commodities often move before broader inflation trends become obvious. A sustained rally in COFFEE could shift expectations across the entire sector and challenge the idea that inflation is fading. With long-term technicals aligning with macro concerns, the market might be entering a phase where key ag goods reprice significantly higher, forcing a reassessment of inflation dynamics worldwide.
 Usman Salis


