The Bollinger Bands is a famous technical indicator created by John Bollinger, an equity trader from the US. Bollinger Bands includes three lines making an envelope. The price stays within this range reaching its tops and bottoms from time to time.
How to Use Bollinger Bands
The idea of this indicator was to combine trend strategies with volatility and oscillator indicators. The bands are indicating the current price direction taking into account the current price volatility. This indicator includes the Moving Average, which shows the main price trend and two other lines limiting price fluctuations and showing the volatility of the asset.
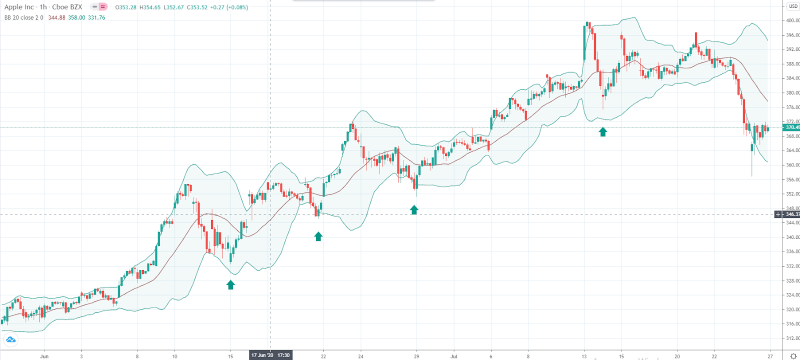
The easiest way to trade using the Bollinger Bands indicator is to buy when the stock in in the bottoms during its uptrend and to sell on tops during the downtrend. The screenshot above shows how to do it. You can also draw a trend line to be sure that you are in the right direction.
However, this strategy has some disadvantages. It is not illustrative, meaning you don’t have precise entry points here. You need other indicators to have more accurate representation of a situation.
BB and the Middle MA
The Bollinger Bands indicator has three lines. Two of them are forming the envelope while the middle line is a Moving Average which is also very important. You can place bets when the price interacts with this middle Moving Average.
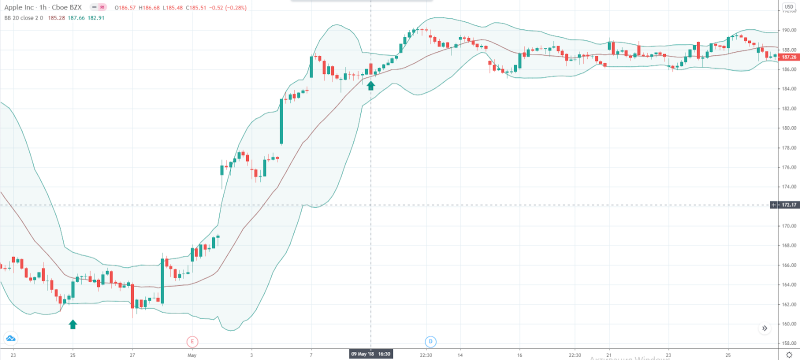
You probably know that the Moving Average is sometimes used as a dynamic support/resistance level. In this strategy, we will use the same principle. When the price rejects the middle Moving Average of the BB indicator, we are going to enter the market.
Here is a great example of how it works. Just look at the screenshot we have posted above. The price goes down from the upper band towards the middle Moving Average and has a couple of Price Action reverse signals. They are helping us to understand that the price is unlikely to move downwards. The Moving Average plays a role of dynamic support here and the price bounces off it later starting a new local uptrend.
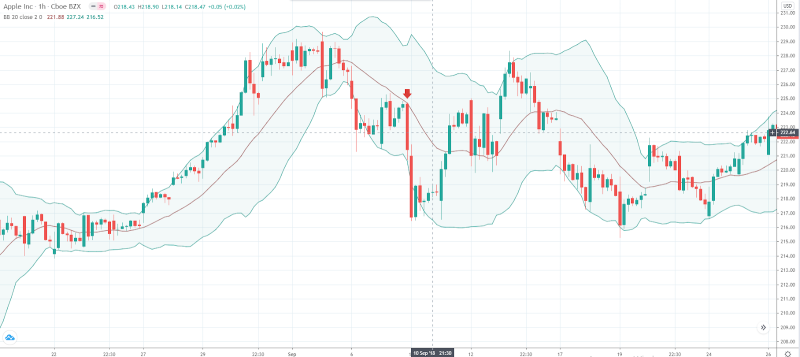
Let’s take a look at the opposite situation. The price starts the global downtrend (we don’t know it in the beginning but this is not important at the moment). Later the price tests the middle Moving Average, which holds the price preventing it from reaching the upper band again. This is a great opportunity to sell the asset and make a profit later.
BB+Graphic Patterns Trading Strategies
Let’s see now how Bollinger Bands work in day trading when we use various patterns including a price gap. Before we start explaining this strategy, let’s establish what the price gap is.
If you look closely at the price chart, almost all the candlesticks are following each other, meaning the closing price of the previous bar is the opening price of the following. However, sometimes there is a gap between two candlesticks when the opening price of the following bar is not equal to the closing price of the previous one.
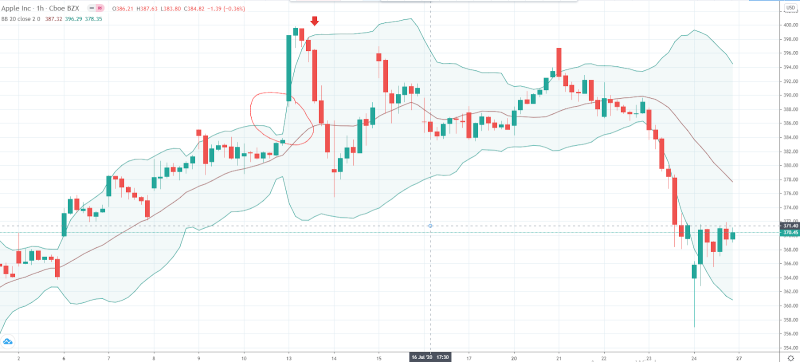
There is one rule that you need to bear in mind – gaps are closing almost every time. This means that further, the price will cover that gap.
Let’s have a look at the screenshot we have posted above. There is a price gap below the the red arrow. We have encircled the area of the gap where the closing price of one green bar does not equal to the opening price of the second green bar.
Moreover, the price is out of the Bollinger Bands upper band, which is a rather rare situation. Applying the rule that we have previously mentioned, you can place a short order expecting the gap to be closed. We advise doing it once the price returns below the upper band of the BB indicator. As you can see, the price moves downwards sometime later.
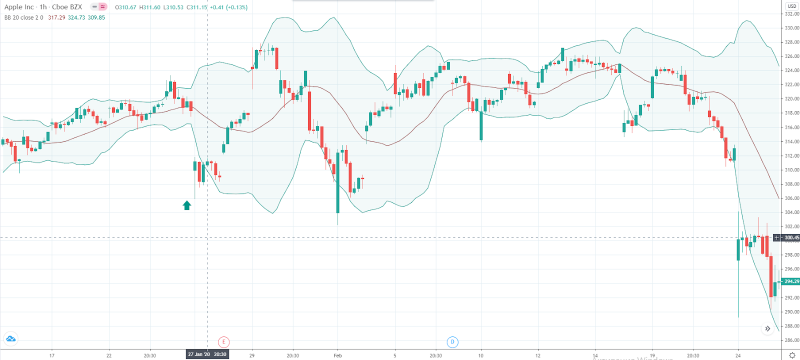
Let’s take a look at the opposite situation. The price breaks down the lower band of the BB indicator. We can see a price gap as the closing price of the previous red candlestick does not equal to the opening price of the green bar.
Moreover, the green bar forms a hammer pattern which is another confirmation of further price reversal. We have even three confirmations of the future local uptrend – the price gap, the hammer pattern, and the breakdown of the lower band of the BB indicator. What else do we need?
Where to close this position? The best way to define that is to wait until the price hits the opposite band of the Bollinger Bands indicator. In our case, we are talking about the upper band.
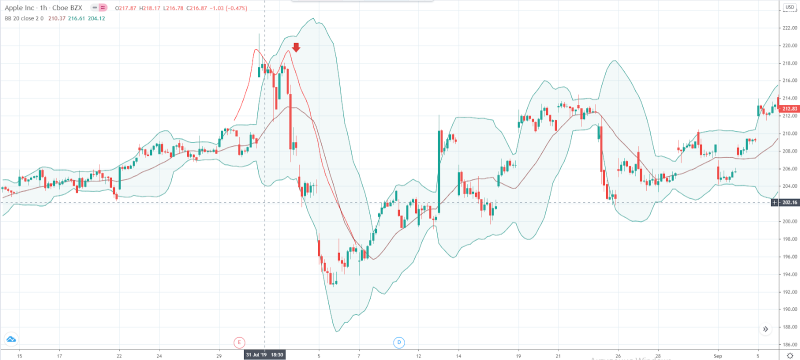
Now it is the time to take a look at a price pattern called 'Double Top'. What is this model about? The price goes upwards and hits its local high. Later, the price corrects itself and once the correction is over, it returns to its local highs. You can see that at the screenshot that we have posted above. What is next? The downtrend begins.
Where to place an order? There are a few approaches, but we recommend waiting until the price breaks down the lower point of the previous correction. However, if you use the Bollinger Bands indicator, you can open a position even earlier. You can see that the first top forms beyond the BB indicator. The second top is slightly below the upper band. You can open a short position once the second top is clearly seen.
By the way, this example is very illustrative as we have another great signal that you can focus on. We are talking about the price gap and the candlestick Shooting Star pattern.
Where to exit this trade? The best way to find the entry point is to look at the position of the price in relation to the lower band. Once they meet, you can exit the market and look for other opportunities.
BB+PA Strategy
Bollinger Bands is a very illustrative indicator, but you need to use some additional tools to have a success with it. We advise working with the Price Action system if you don’t want to use any additional indicators. What is this strategy about?
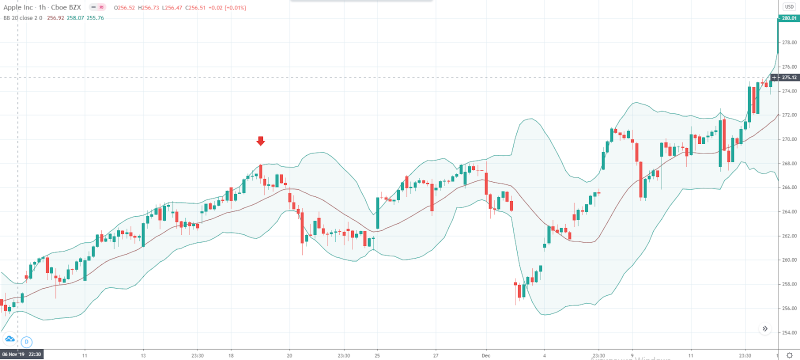
There are two main signals in this strategy that you should always keep in mind. The price should reach one of the borders of the envelope. The second trigger is a Price Action signal. In our example, there is an engulfing pattern (when the right candlestick engulfs the left one).
This strategy looks very easy when you have profound knowledge of price action. You can easily substitute this engulfing pattern with any other Price Action model. The result will be the same.
BB+RSI Trading Strategy
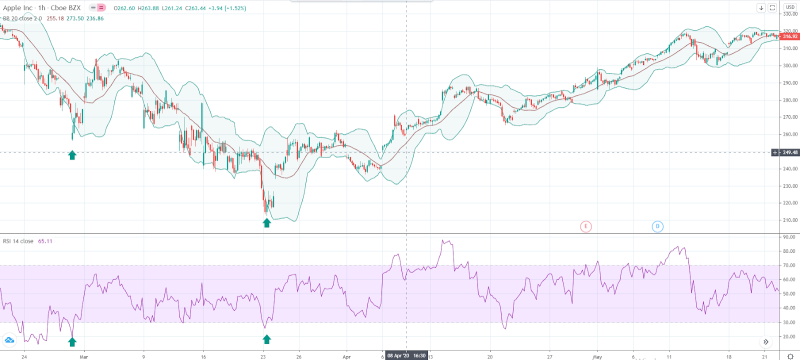
In this strategy, we will use the boundary lines of the envelope as the dynamic support and resistance areas. This trading system includes the Relative Strength Index indicator, which is a pure oscillator helping us to see the reverse points, where one trend substitutes the other and where the correction starts and ends.
The Relative Strength Index has two additional horizontal lines at 30 and 70. When the signal line of the RSI indicator falls below 30, the asset is 'oversold,' meaning it can start the uptrend in the nearest future. When the signal line of the RSI indicator jumps over 70, the stock is 'overbought,' meaning the uptrend (or an upside correction) is close to an end and we are going to see some stock price's plunge in the nearest future.
Let’s take a closer look at this strategy’s signals. We have pointed out two trading opportunities in the screenshot above. You need to look at the BB indicator first in order to see its position. In our case, the price hits the lower band of the envelope signaling the end of the local downtrend.
Now its time to look at the RSI indicator. Its signal line plunges below 30. This is not the signal yet, but we should prepare ourselves to open a long position. When it is time to place an order? Once the RSI indicator signal line breaks out a 30 horizontal line from below. As you can see, the price moves upwards in both cases after the signal confirmation.
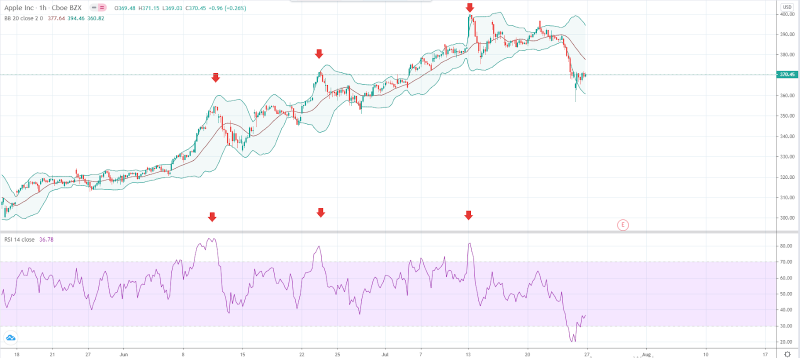
Now it is the time to look at the opposite situation. When the price hits the upper band of the BB indicator, we have a signal that the trend is going to change. However, there is still no confirmation of the reverse if we use BB alone.
Let’s take a look at the RSI indicator. The signal line if above 70 telling us the asset is currently overbought. It is not the time to place an order, but we have to prepare for trading. Once the signal line falls below 70, you can enter the market.
Additional Information
Here are some important issues to pay attention to:
- If the RSI signal line crosses a level of 50, there is a probability of the current trend to stop.
- If the price has crossed the middle line of the Bollinger Bands indicator, there is a probability of trend being changed.
- You can use RSI to track divergence.
- You can use the price action trading system to minimize the number of fake signals.
BB+MA200 Trading Strategy
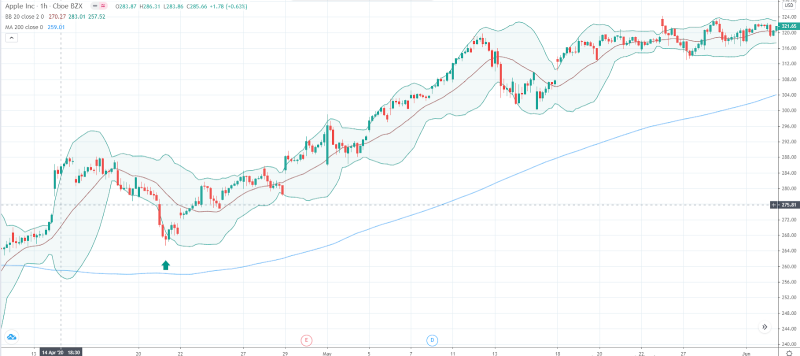
Trading with Bollinger Bands is not limited to only a couple of strategies. Here is another way to use this indicator. This time we combine it with a Simple Moving average. The length is set at 200. This strategy requires some knowledge of basic price action.
How to use this strategy? You need to look at the position of the price in relation to the MA200. If the price is above the Moving Average, the asset has the uptrend. What does it mean? We are going to look for 'to buy' signals.
If you look closely at the screenshot we have posted above you can see that there is a hammer signal indicating that the price is likely to start growing. This is a long term strategy. You can exit the market once the price breaks down the MA200.
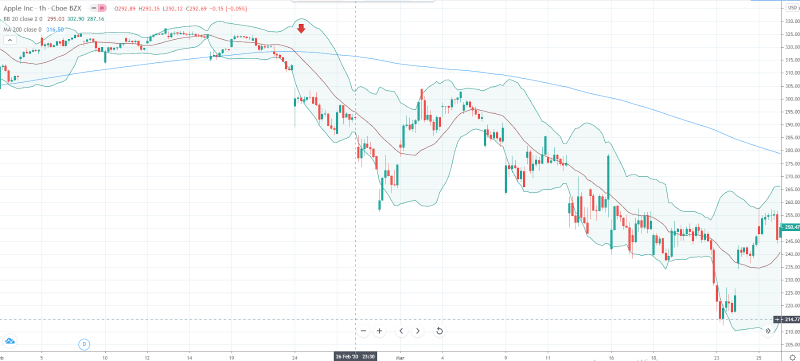
Let’s have a look at how to trade Bollinger Bands in the opposing situation. The price crosses the MA200 from above. Later the price continues to move downwards without any attempt to get closer to the MA200. This is a great opportunity to hold your trade until the price hits the MA200.
BB+Stochastic Oscillator
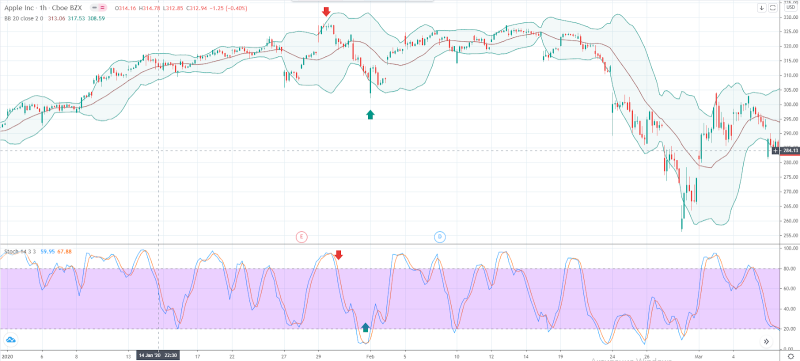
Bollinger Bands can offer some more opportunities when you use it with Stochastic. This oscillator shows traders the moments when the price is overbought and oversold. There are two levels: 80 and 20. When the signal line is above 80 this means that the asset is overbought. On the other hand, when the price is below 20, the asset is oversold.
How to trade Bollinger Bands using this method? Look at the screenshot we have posted above. We have pointed out two trading signals, one for a long position and one for a short one. The price reaches the upper band in the first case (to the left). Now it is time to look at what Stochastic has for us. Two signal lines of the Stochastic indicator have crossed their paths. The Stoch is above 80 telling us that the asset is currently overbought.
It is time to prepare yourself for trading. Once the signal line of the Stochastic indicator falls below 80, you can place an order. When to leave the market? The best way to find the exit point is to wait until the price reaches the opposite band of the BB indicator.
Let’s now have a look at the 'to buy' signal (green arrows). The price has reached the lower band of the Bollinger Bands indicator. It is time to look at what is happening with the signal line of the Stoch indicator. It being below 30 means that the asset is now in the oversold position. It is still not the time to place an order, but it is a signal for you to monitor the situation and wait for the upcoming opportunity. Once the signal line breaks out 30 you can buy the stock (or any other asset you want to trade) and hold it until the price reaches the opposite band of the BB indicator (the upper one in our case).
BB+MACD Trading Strategy
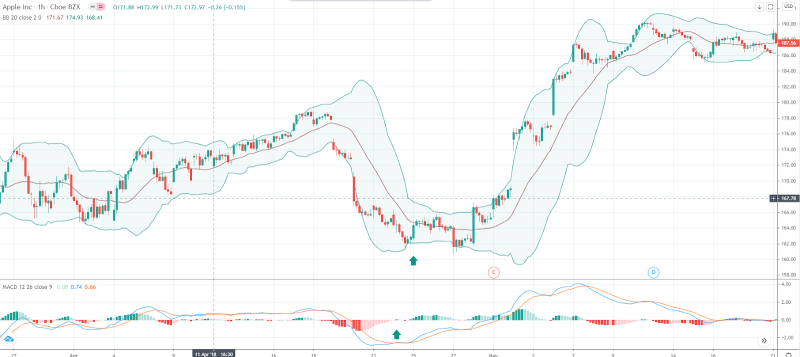
The Moving Average Convergence Divergence indicator is a great additional tool for a Bollinger Bands’ strategy. The easiest way to use both of those indicators together is to find the places where the Moving Averages of the MACD cross with each other below the histogram. This is the first trigger that you can use to closely monitor the current situation. The next thing you need to do is to look at the price chart and the position of the asset relative to the Bollinger Bands indicator. For long trades, the price should be hitting the lower band. Once this happens, you can buy the asset.
BB+Volumes Trading Strategy

The trend when we are talking about a true trend is always supported by the high volumes. When the price is close to the lower or upper band, you can pay attention to the volumes' indicator. The histogram should reflect the volume's growth.
This strategy is rather simple. You don’t need much knowledge to use it. Once you see the growing volumes, something is going to happen on the market. In our case, the growing volumes mean the uptrend, and the price steps out the Bollinger Bands indicator having a gap.
Conclusion
The aforementioned ways are the most popular strategies using the Bollinger Bands indicator. However, this list is not complete. You can create your own strategies using all the benefits of this great indicator. Let us know your favorite strategy in the comments below!
 Peter Smith

 Peter Smith


