 Saad Ullah
⬤ U.S. inflation keeps cooling down based on Truflation's real-time price tracking. The Truflation US CPI Inflation Index now sits at just 1.18% year over year, updated continuously with fresh pricing data. The latest chart from January 27, 2026, shows inflation dropping steadily over recent months, plummeting from late-2025 peaks toward the bottom of its yearly range.
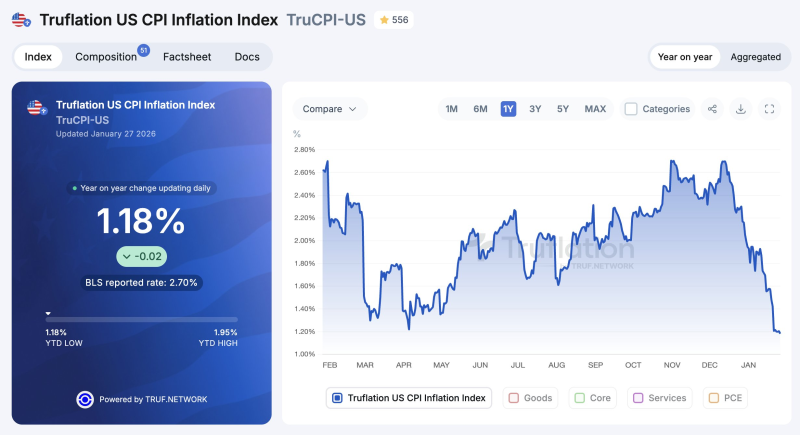
⬤ Truflation's U.S. Personal Consumption Expenditures measure comes in at 1.4% right now. Both numbers run way below the Bureau of Labor Statistics' official CPI reading of 2.70%. The Truflation CPI has bounced between a 2026 high around 1.95% and today's low of 1.18%, showing just how fast price pressures have melted away in recent weeks.
⬤ Truflation pulls together millions of price points from dozens of independent sources covering everything from groceries to services. While traditional inflation reports rely on monthly surveys, Truflation's CPI refreshes daily to catch pricing shifts as they happen. The data shows inflation topped out above 2.5% earlier this year before rolling over hard and accelerating lower into January.
⬤ This growing gap between real-time and official inflation numbers matters for markets. Persistent disinflation signals could reshape expectations around Fed policy, interest rates, and economic momentum. If alternative measures keep pointing lower before official releases catch up, traders may increasingly turn to real-time gauges to spot turning points. The question now is whether official inflation metrics eventually converge with these much lower readings in the coming months.
 Saad Ullah


