 Usman Salis
⬤ US inflation continued to ease as the TruCPI US CPI Inflation Index declined to 1.20 percent on a year-over-year basis. The index, which updates daily, reflects a sustained slowdown in price pressures over the past year. The latest reading marks a new low following roughly 52 weeks of gradual disinflation.
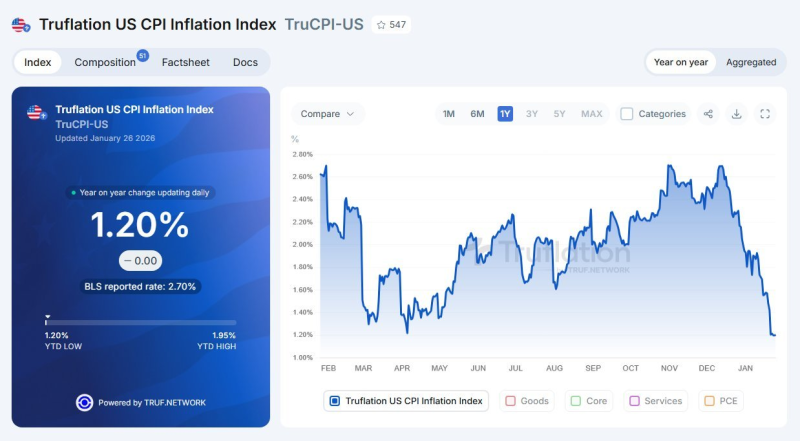
⬤ The data shows a clear downward trend in the TruCPI measure, falling from levels above 2.5 percent earlier in the year to near 1 percent by late January. The year-to-date low sits at 1.20 percent while the high reached 1.95 percent. This paints a picture of cooling inflation, though a notable gap exists between TruCPI and the official US Consumer Price Index—the Bureau of Labor Statistics currently reports an annual CPI rate of 2.7 percent.
⬤ While realized inflation according to TruCPI has weakened, market-based expectations remain higher. Inflation swaps are trading around the 2.4 to 2.5 percent range, signaling that derivatives market participants are pricing in higher future inflation than what current spot indicators suggest. This divergence underscores differing views on whether the recent disinflation trend will hold or reverse over time.
⬤ This gap matters for financial markets because inflation measures shape interest rate expectations, policy outlooks, and asset pricing. When alternative inflation indicators and market-implied expectations diverge this widely, it can fuel uncertainty and volatility. The TruCPI reading at 1.2 percent shows how different inflation gauges may send contrasting signals about underlying price pressures in today's economy.
 Usman Salis


