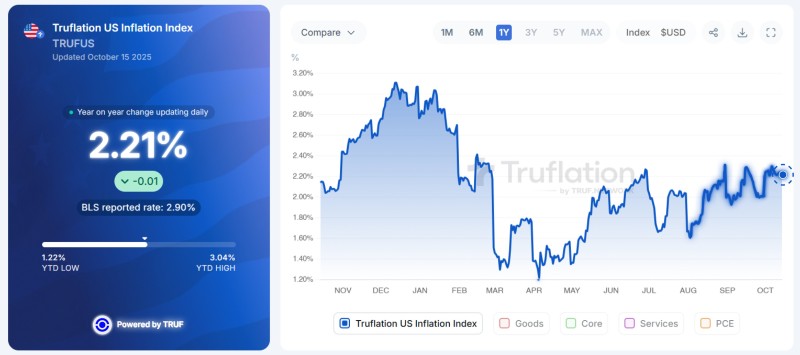
The US economy faces uncertainty as the government shutdown enters its third week. With official inflation releases suspended, investors and policymakers now depend on alternative trackers, which show year-over-year inflation at 2.21% as of October 15.
Trader Insights: Official Data Goes Dark
According to trader analysis using Truflation's real-time independent economic data, inflation appears stable even though the Bureau of Labor Statistics can't release the Consumer Price Index and other key indicators.

The latest reading of 2.21% contrasts with the previous official BLS figure of 2.9%, revealing methodology differences that matter more than ever. The extended shutdown has hit critical areas hard:
- 4,000 federal workers permanently dismissed
- 13,000 air traffic controllers under severe strain
- Core surveys from BLS, Census Bureau, and BEA frozen completely
This means wage data, employment figures, and price tracking have all stopped, creating fog around inflation expectations and making Federal Reserve decisions much harder.
Chart Analysis: Where Inflation Stands
Looking at the trends, inflation hit bottom at 1.22% back in April before climbing back up and settling around the 2.2% range. This floor suggests underlying price pressures haven't disappeared despite weaker demand. The year started with inflation peaking at 3.04% before cooling through autumn. Now we're seeing stabilization that hints inflation might stay sticky above 2%. Independent trackers have become essential for continuity when government numbers vanish.
What This Means for Markets and Policy
The Fed is essentially flying blind without official data. Investors should keep an eye on Treasury yield swings as inflation risk gets repriced, equity volatility especially in rate-sensitive sectors like tech, and commodities where weaker oil prices might help ease pressure.
 Victoria Bazir

 Victoria Bazir


