Saad Ullah
⬤ U.S. inflation is currently running at just 0.87% year-over-year according to the latest Truflation real-time tracking index. The platform pulls daily pricing data from multiple sectors to give a current snapshot of where prices actually stand right now.Goods inflation is sitting at 0.72%, services at 0.94%, and core inflation at 1.46%.
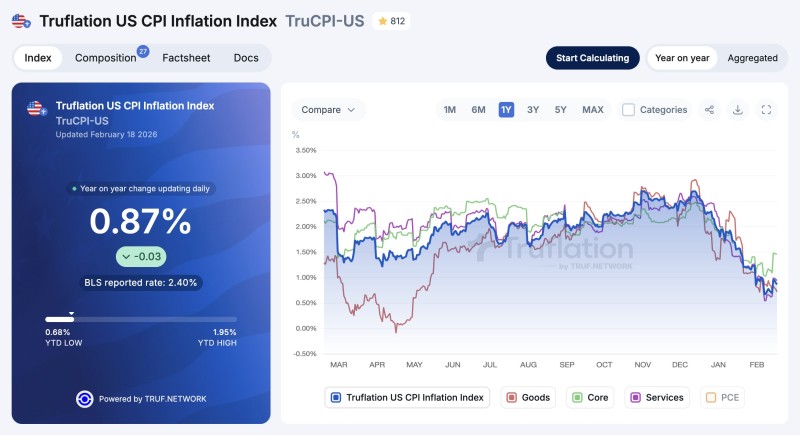
⬤ Looking at the chart, there's a clear downward trend across the board over the past twelve months. Goods, services, and core measures have all been gradually sliding toward that 1% mark, which points to consistent cooling rather than just one or two categories dropping off. This isn't the first time we've seen a gap between real-time readings and official numbers - a similar pattern showed up in US inflation drops below 1% TruCPI hits 0.94% YoY vs BLS 2.40%.
⬤ The advantage of this type of index is speed. Because it updates constantly, price shifts show up much faster than they do in monthly government reports. As one analyst noted, "When headline, goods, services, and core inflation move lower simultaneously, it reflects broad price stabilization rather than isolated sector adjustments." That matters for anyone trying to get ahead of policy moves or rate decisions.
⬤ The bigger picture here ties into what's happening with debt and rates. With trillions in U.S. debt rolling over soon, inflation readings like this could influence how aggressively the Fed acts - something explored further in US debt $9.6T maturing in 2026 puts focus on rates and policy.
⬤ What stands out most is the alignment. When every major category is moving in the same direction at the same time, it's not noise - it's a signal that underlying price pressures are genuinely easing across the economy.
 Saad Ullah