 Saad Ullah
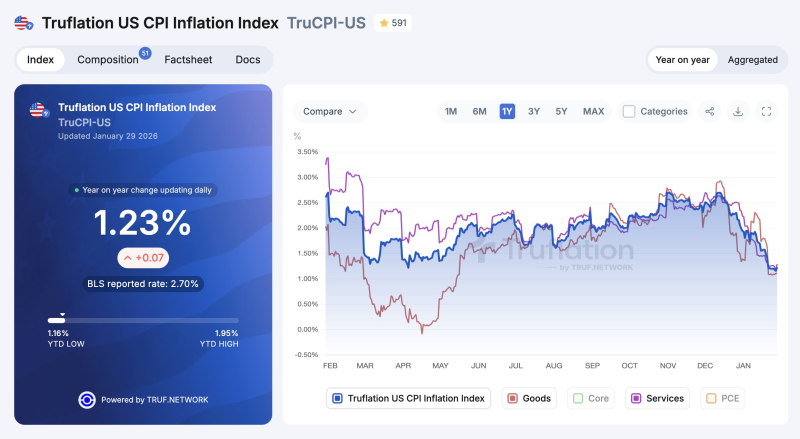
⬤ US inflation readings at the end of January show a growing gap between real-time price data and official government statistics. The Truflation US CPI Inflation Index came in at 1.23% year-over-year as of January 29, 2026—well below the most recent BLS reported rate of 2.70%. The difference highlights how high-frequency pricing data is diverging from traditional survey-based inflation measures.
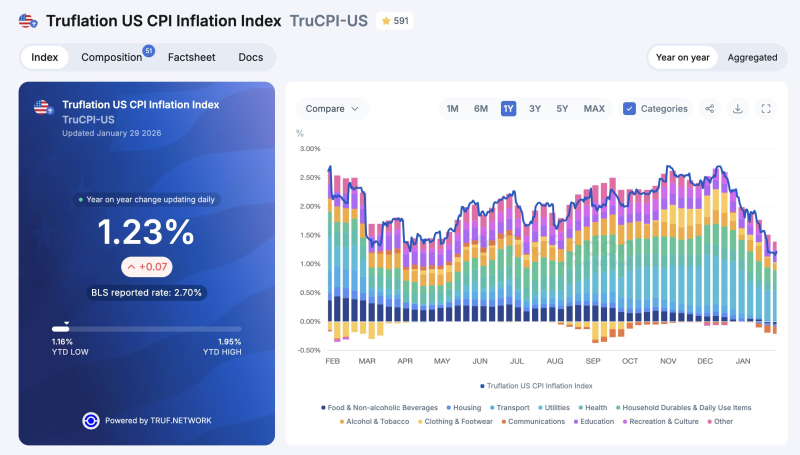
⬤ Inflation across goods and services has become more evenly distributed than earlier in 2025. The tariff-driven surge in goods inflation seen in early 2025 is now subsiding, with several categories moving toward flat or even negative territory. This suggests price pressure relief is broadening rather than staying concentrated in one sector, as shown by reduced divergence between goods and services inflation over the past year.
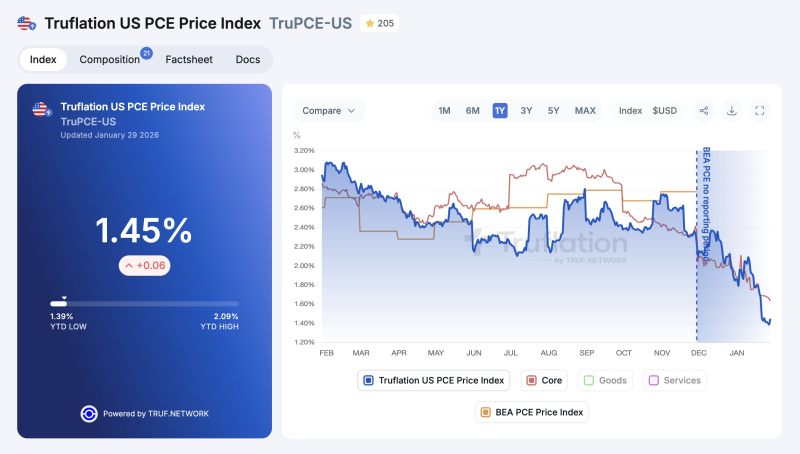
⬤ Truflation's US PCE Price Index stands at 1.45%, with core PCE inflation at 1.63%—both well below official Bureau of Labor Statistics measures. Core PCE inflation remains above the Federal Reserve's 2% target in official reports, but those figures only reflect data through November 2025, highlighting the lag between government reporting cycles and real-time price tracking.
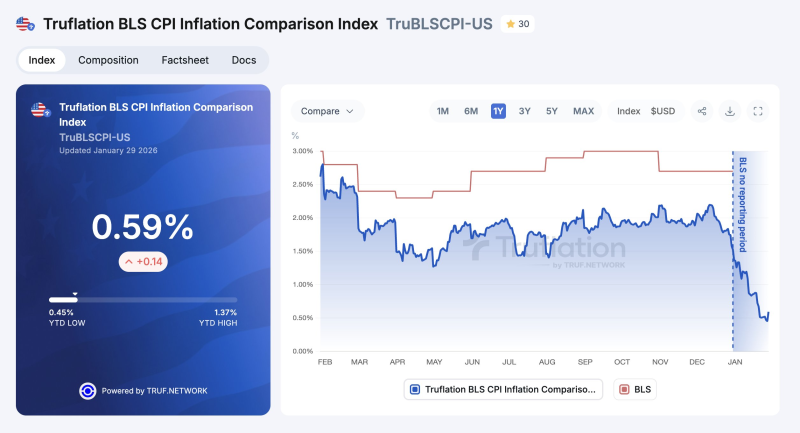
⬤ Truflation's BLS CPI Comparison Index, which applies official BLS weights and categories to millions of Truflation price data points, currently reads 0.59%—even lower than Truflation's custom CPI measure. This suggests inflation pressures captured by official statistics may already be easing faster than headline figures indicate. As markets evaluate interest rate policy expectations and broader economic conditions, the widening gap between real-time inflation data and legacy indicators is becoming increasingly relevant.
 Saad Ullah


