 Marina Lyubimova

⬤ Global money supply has grown faster in the last five years than in the previous 50 combined. Since 2020, global M1 has jumped by roughly $25 trillion—more than the $20 trillion increase that took over half a century to accumulate. The chart shows this dramatic acceleration, with narrow money climbing steeply after decades of slow, steady growth.
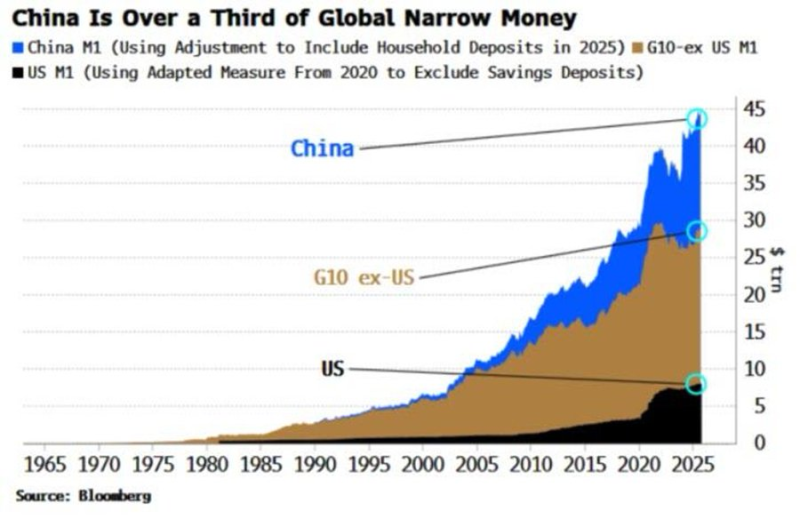
⬤ China dominates the picture, now accounting for over one-third of global narrow money. Using an adjusted M1 measure that includes household deposits from 2025, China's share towers over both the United States and the combined G10 economies excluding the US. Even with US M1 calculated using an adapted 2020 measure that strips out savings deposits, China's total remains significantly larger in absolute terms.
It took more than 50 years for global money supply to increase by around $20 trillion, while since 2020 global M1 alone has expanded by approximately $25 trillion.
⬤ The timeline from the mid-1960s through 2025 reveals just how abnormal recent years have been. For decades, global M1 rose gradually along a predictable path. After 2020, the line shoots upward, reflecting massive liquidity injections across major economies. While the G10 ex-US group shows notable expansion, China's contribution climbs most sharply, pushing total global narrow money far beyond historical norms by 2025.
⬤ This matters because the scale and speed of money supply growth shapes everything from inflation to asset prices. Such rapid M1 expansion challenges the notion that inflationary pressures are temporary. As liquidity keeps building across major economies, the relationship between money supply, currencies, and inflation expectations remains a key driver of global market trends.
 Marina Lyubimova


