Saad Ullah
⬤ UK inflation is back at 3%, and the latest historical comparison makes one thing clear: the country is not heading back to the ultra-low inflation era that defined much of the previous decade. The chart titled UK Consumer Price Inflation in 37 Years (1989-2026) puts the current reading in a much wider context. While inflation has cooled from its recent peaks, cost-of-living pressure is still very much felt.
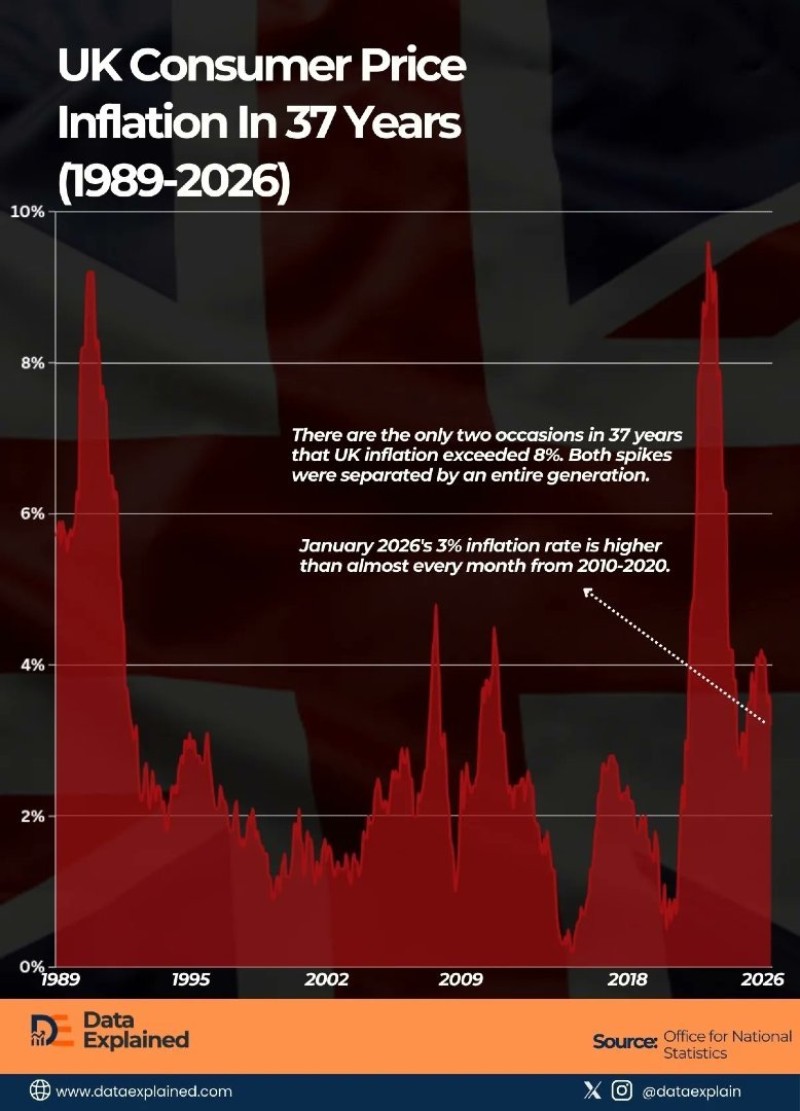
⬤ The data reveals that UK inflation has only crossed the 8% threshold twice in 37 years. The first spike came in the early 1990s, the second arrived in the early 2020s when prices surged close to double digits before pulling back. As the chart makes clear, January 2026's 3% reading is still higher than almost every single month between 2010 and 2020 - a reminder of just how unusually quiet that decade was for prices.
⬤ That context is exactly why a 3% figure continues to be described as stubbornly elevated. Inflation has slowed sharply from its crisis peak, but price growth remains above the range that quietly defined the 2010s. The same theme runs through TheTradable's related coverage: UK inflation hitting 3.0% CPI and UK CPI slowing to 3.03% both examine how recent prints stack up against historical norms.
⬤ With inflation sitting at 3%, the long-term chart points to a structural shift away from the calm of 2010-2020 toward a higher baseline for price growth. The crisis levels above 8% are gone, but so is the consistently low range that once defined the UK economy. As covered in UK inflation dropping to 3.6% as price pressures cool, the broader macro narrative heading into 2026 is one of adjustment - not a clean return to the old normal.
 Saad Ullah