Alex Dudov

⬤ EUR/USD just hit a rough patch after what looked like a solid rally. The hourly chart tells the story—price broke below the Fibonacci 0.382–0.5 zone, which basically means the bulls are losing their grip. We're now seeing a lower high forming, and that's putting the pair right at a make-or-break level where traders need to pick a side.
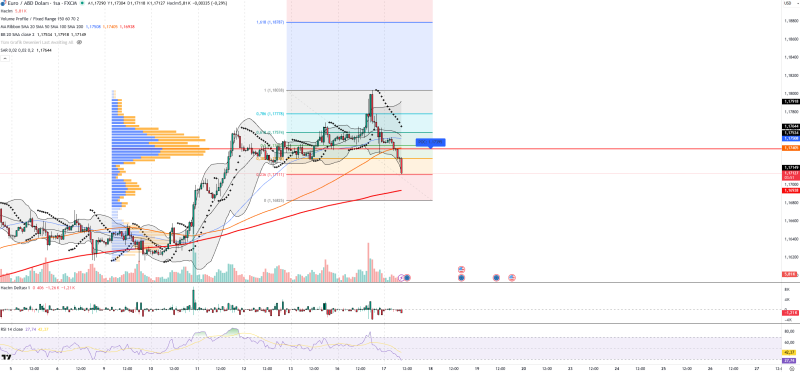
⬤ The technicals aren't painting a pretty picture either. Price is sitting below short-term moving averages and hugging the lower Bollinger Band—classic signs that volatility's heating up and the structure's getting shaky. RSI crashed to around 28, which screams oversold territory and hints at a possible bounce. But here's the catch: volume shows sellers are still actively pushing, so this isn't just exhaustion yet.
⬤ The volume profile adds another layer to the picture. That key level near 1.1740 where price was hanging out? It's been breached, meaning the old balance zone is gone. Parabolic SAR dots flipped above price, backing up the bearish vibe. Support's now sitting at 1.1715, 1.1698, and 1.1682, while resistance is stacked at 1.1740, 1.1754, and 1.1778. The bigger trend isn't totally broken yet, but if support gives way, this pullback could turn into something deeper.
⬤ Why does this matter? EUR/USD moves on two main drivers right now—dollar strength and macro expectations. The greenback's been firming up thanks to decent U.S. data, while the ECB hasn't given traders any fresh hawkish reasons to buy euros. With momentum fading near these technical spots, the next batch of economic data and whatever the Fed signals will likely dictate where EUR/USD heads from here.
 Alex Dudov