 Alex Dudov
⬤ XRP is currently trading well below several dense liquidity zones that haven't been touched on higher timeframes. The Binance XRPUSDT liquidation heatmap shows heavy liquidity stacked above where we are now, especially in the $2.5 to $4.0 range. Even with the recent downtrend, XRP hasn't reached these upper bands, which means there's a real chance we could see a liquidity-driven rally.
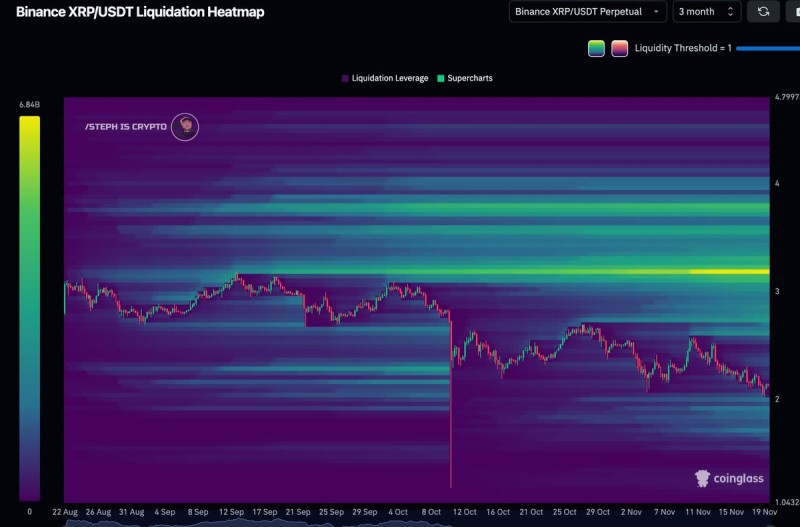
⬤ The heatmap reveals strong clusters of liquidation leverage, with bright green and yellow regions marking where the most concentrated liquidity sits. These upper zones haven't been tested once during the entire three-month period shown. Price action dropped from mid-September into November, hovering around the low $2 range, but it's still far from those high-liquidity regions above. That gap tells us most of the resting liquidity is overhead rather than below current levels.
⬤ There was a sharp liquidation spike in early October, but even that dramatic move didn't sweep through the major liquidity layers sitting above. After that drop, XRP settled into a tighter range while staying separated from those unfilled liquidity pockets. The heatmap shows a clear structural imbalance: thicker, brighter liquidity accumulation positioned higher up, which often signals potential price movement toward those levels when volatility kicks in.
⬤ This matters because liquidity positioning plays a major role in shaping where the market goes next, especially in leveraged products like XRP perpetual futures. With heavy liquidity still untouched above spot price, the market could easily get pulled toward these zones during the next volatility cycle, which would shift sentiment and short-term price expectations.
 Alex Dudov


