 Marina Lyubimova

After months of sideways movement, XRP appears to be reaching a pivotal moment. While the price might dip a bit more in the coming days, several technical indicators suggest we could be on the verge of a meaningful reversal.
What the Charts Are Telling Us
Crypto analyst DustyBC Crypto recently highlighted a narrow support area where he believes "the magic will happen." Looking at the 8-hour timeframe, XRP has been moving within a descending channel, forming what looks like an ABCDE correction pattern:
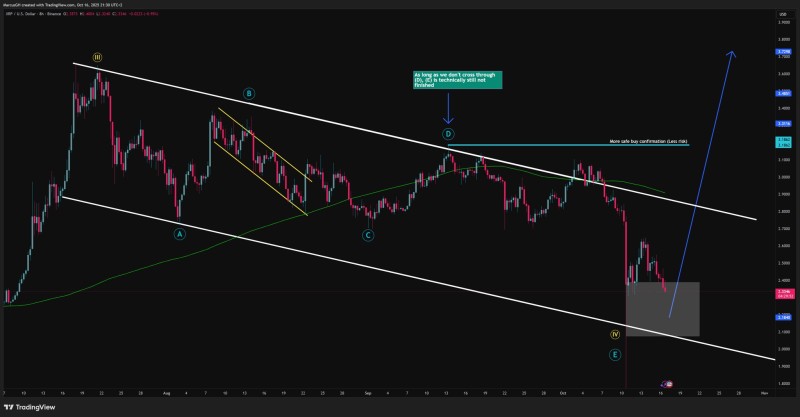
- Current Support: The $2.30–$2.18 zone is where buyers have historically shown up
- The Channel: Price is still trapped in a downward-sloping pattern, with the floor around $2.18 and ceiling near $3.18
- Breakout Level: Getting above $3.18 would be the clearest sign that bulls are back in control
- Upside Targets: If momentum builds, watch for resistance around $3.45 and $3.72 based on Fibonacci levels
The chart shows a gray accumulation box highlighting the current pullback as part of a natural market cycle. For patient investors, this could represent a solid entry opportunity with favorable risk-reward.
What Could Drive the Next Move
A few things worth watching: Bitcoin's performance above $60,000 typically gives altcoins like XRP a lift. Ripple continues making progress with its cross-border payment solutions, which keeps institutional interest alive. And with the SEC case winding down, even partial regulatory clarity could bring buyers rushing back in.
 Marina Lyubimova


