 Peter Smith
● In a recent breakdown, Ali spotlighted important support and resistance zones for XRP using Glassnode's UTXO Realized Price Distribution (URPD) data. The chart shows that $2.15 marks a solid support level, while $2.80 stands as the main resistance barrier—essentially highlighting where most XRP investors have locked in gains or built their positions.
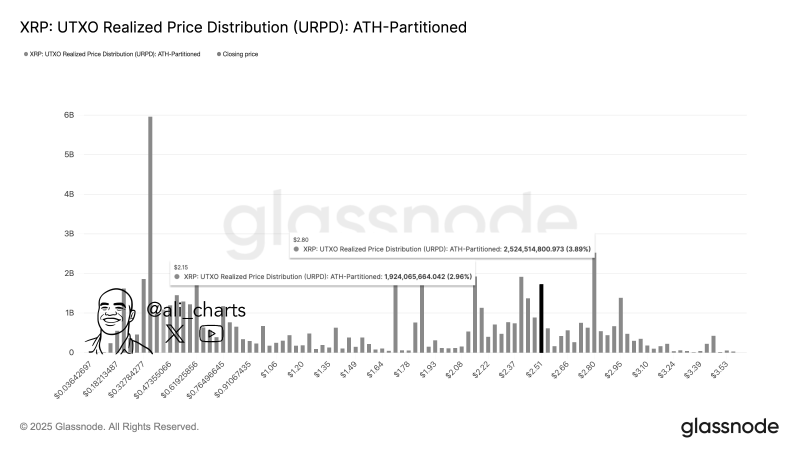
● The numbers tell an interesting story: roughly 2.96% of XRP's total supply was realized around $2.15, while about 3.89% changed hands near $2.80. These clusters point to heavy trading activity and liquidity build-up—zones where investors have clearly shown strong interest, either buying or selling. Levels like these tend to act as psychological speed bumps, influencing how traders react in the short term.
● The URPD chart maps out how much XRP last moved at different price points, giving us a window into the behavior of long-term holders versus those just passing through. With most of the realized value packed between $2.15 and $2.80, this range is now defining XRP's near-term market structure.
● "Two key levels for $XRP: support at $2.15, resistance at $2.80," Ali noted, summing up the technical picture cleanly. It's a tug-of-war—buyers holding the line at the bottom, sellers stacking up at the top.
● If XRP can hold steady above $2.15, that could spark fresh bullish energy and set up another run at the $2.80 resistance. A clean break above that could flip the script entirely, possibly triggering a faster climb toward the higher Fibonacci targets some analysts have been eyeing. On the flip side, getting turned away at resistance might mean a pullback and more sideways action around lower levels.
● Right now, all eyes are on these two pivotal prices—$2.15 and $2.80—which are likely to dictate XRP's next move as the broader crypto market continues its upward push.
 Peter Smith


