 Usman Salis
Liquidity is everything in crypto - it's where the big players park their orders and where price gets pulled like a magnet. Right now, XRP's liquidity maps are flashing some serious signals about where the action's heading next.
Daily Chart: The $4 Wall Everyone's Watching
Thanks to analysis from Cryptoinsightuk, we can see exactly where the battles are being fought on both daily and hourly timeframes.
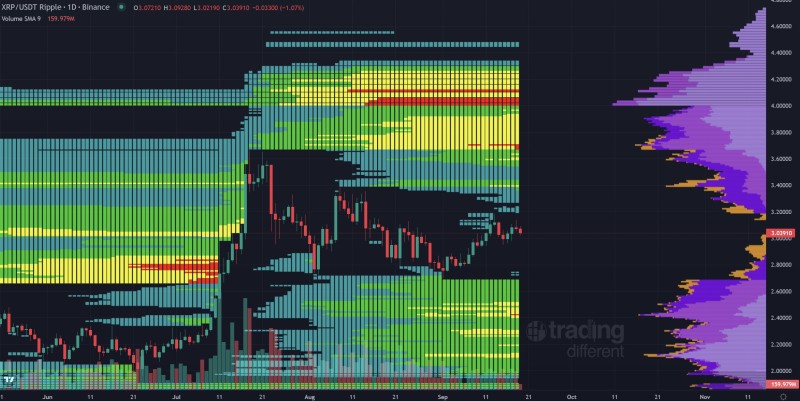
The daily picture shows XRP caught in a liquidity sandwich between $2.80 and $3.60. That's where most of the action is happening right now. But here's the kicker - there's a massive liquidity wall sitting at $4.00 that's basically screaming "major resistance ahead." When XRP has hit zones like this before, things got volatile fast. Break above $3.60 with conviction, and that $4.00 level becomes the next big test.
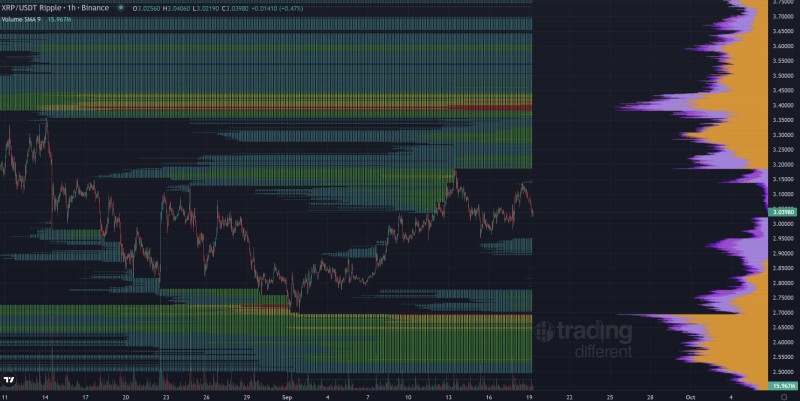
Hourly Focus: Fighting for $3.00
Drill down to the hourly chart and you'll see the real battle is happening between $2.95 and $3.10. This tight range has become the make-or-break zone for day traders. Push through $3.10 with volume behind it, and XRP could rocket toward $3.40 where more liquidity is waiting. Lose $3.00 though, and we're probably heading back to test $2.80 support.
These liquidity zones aren't just lines on a chart - they show you where the real money is positioned. They reveal:
- Perfect entry and exit spots for quick trades
- Breakout levels that could trigger explosive moves
- Warning signs if support zones start cracking
 Usman Salis


