 Usman Salis

XRP (Ripple) is approaching a pivotal moment as liquidity data reveals where the bulk of buy and sell orders sit. Liquidity maps offer a clear window into where traders are most active, acting as natural price magnets that shape near-term movements. Looking at both daily and hourly timeframes gives investors a sharper view of the key levels that could drive XRP's next direction.
Daily Liquidity Overview
As analyst Cryptoinsightuk noted, the daily chart shows XRP hovering around $2.80–$2.85, where it's currently consolidating.
Above current price, heavy supply sits between $3.40 and $4.20, with especially thick clusters near $3.80–$4.00. These zones represent strong resistance that could cap upside momentum for now.
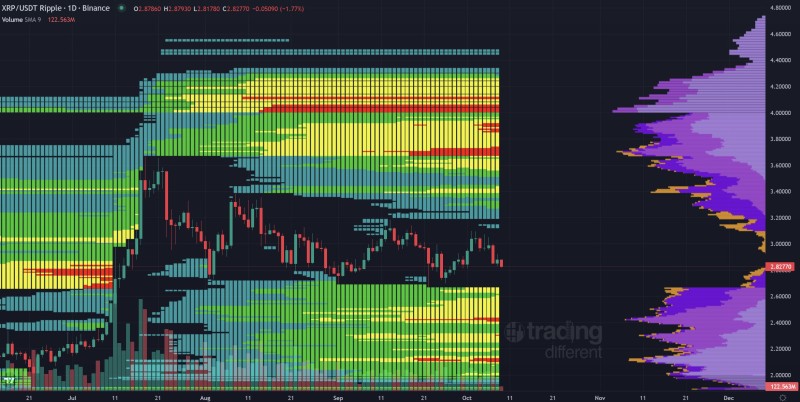
Below, significant demand appears between $2.40 and $2.60, forming a solid support base. If XRP dips to retest these lower levels, liquidity absorption might stabilize things before any deeper pullback takes hold.
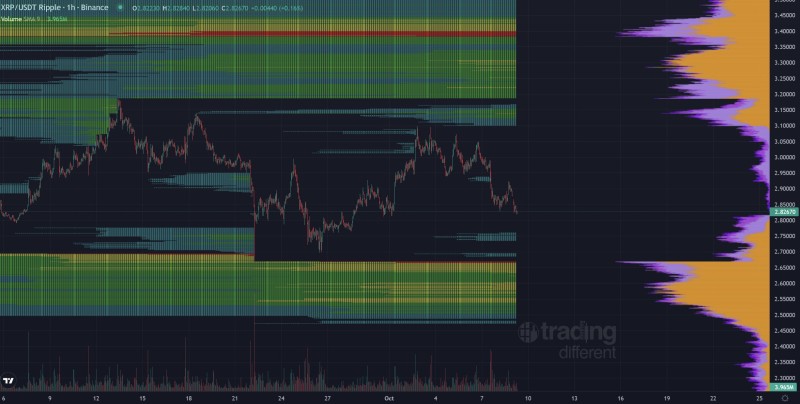
Hourly Liquidity Map
On the hourly chart, XRP keeps testing $2.80 as a crucial short-term level. Liquidity clusters show where big players might push price in the near term. Buy-side liquidity stacks up lower at $2.60, while notable sell-side pressure emerges around $3.00–$3.20. These high-volume zones often act as magnets, pulling price toward them before any sustained move can develop.
What This Means for Traders
The liquidity data highlights a tug-of-war between buyers and sellers. For XRP, the charts point to a range-bound setup, with downside support defending the $2.60 area and overhead supply capping rallies near $3.40 and above. Traders should keep an eye on how volume interacts with these clusters - absorption on either side could set up XRP's next meaningful move.
 Usman Salis


